USD/JPY Price Forecast: Bears defend 159.00, eye a close below 158.00
- USD/JPY drops sharply as geopolitics boost Yen safe-haven demand.
- Bearish engulfing risk rises if price closes below the 20-day SMA.
- Break under 157.50 exposes 157.00 and 156.16 support levels.

The Japanese Yen (JPY) begins the week on a strong foot as USD/JPY falls some 0.67% on Monday amid an improvement in risk appetite, following the White House's delay of attacks on Iran for five days and its claim that the US had "very productive" talks with Tehran. At the time of writing, the pair trades at 158.06.
USD/JPY Price Forecast: Technical Outlook
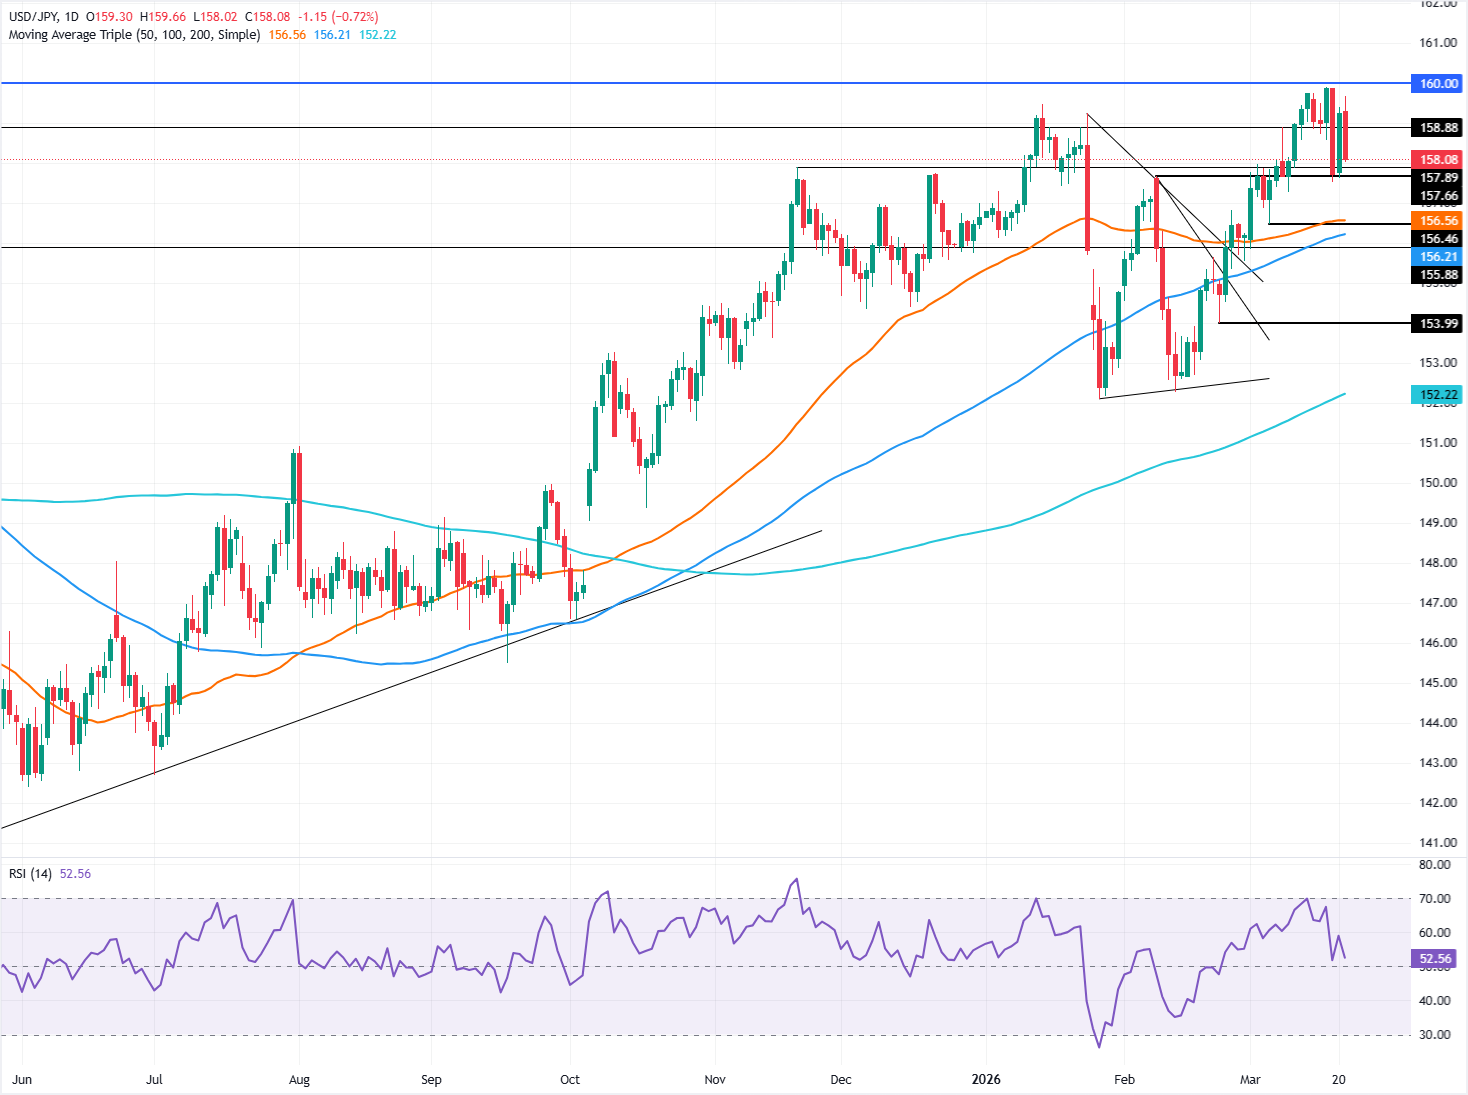
Last Friday, the USD/JPY technical picture was bullish-biased, but the sudden reversal on Monday could open the door to a test of the next key support at 156.46, the March 5 swing low.
Momentum remains bullish but appears to be fading, as indicated by a falling Relative Strength Index (RSI) that is about to clear the 50-neutral level.
If USD/JPY closes the day below the 20-day SMA at 157.91, it would form a bearish engulfing pattern, clearing the way for further downside. The next support would be 157.50, followed by the 157.00 figure, the March 5 cycle low at 156.46, and the 100-day SMA at 156.16. Below this level, the next area of interest is the February 23 daily low at 153.99.
On the upside, bulls must climb back above 159.00 if they want to remain hopeful of challenging the 160.00 milestone.
USD/JPY Price Chart – Daily
Japanese Yen Price Today
The table below shows the percentage change of Japanese Yen (JPY) against listed major currencies today. Japanese Yen was the strongest against the US Dollar.
| USD | EUR | GBP | JPY | CAD | AUD | NZD | CHF | |
|---|---|---|---|---|---|---|---|---|
| USD | -0.47% | -0.77% | -0.71% | -0.09% | -0.01% | -0.68% | -0.35% | |
| EUR | 0.47% | -0.30% | -0.20% | 0.42% | 0.59% | -0.22% | 0.12% | |
| GBP | 0.77% | 0.30% | 0.09% | 0.73% | 0.89% | 0.08% | 0.41% | |
| JPY | 0.71% | 0.20% | -0.09% | 0.64% | 0.70% | -0.03% | 0.35% | |
| CAD | 0.09% | -0.42% | -0.73% | -0.64% | 0.06% | -0.72% | -0.31% | |
| AUD | 0.00% | -0.59% | -0.89% | -0.70% | -0.06% | -0.80% | -0.38% | |
| NZD | 0.68% | 0.22% | -0.08% | 0.03% | 0.72% | 0.80% | 0.36% | |
| CHF | 0.35% | -0.12% | -0.41% | -0.35% | 0.31% | 0.38% | -0.36% |
The heat map shows percentage changes of major currencies against each other. The base currency is picked from the left column, while the quote currency is picked from the top row. For example, if you pick the Japanese Yen from the left column and move along the horizontal line to the US Dollar, the percentage change displayed in the box will represent JPY (base)/USD (quote).
Author

Christian Borjon Valencia
FXStreet
Markets analyst, news editor, and trading instructor with over 14 years of experience across FX, commodities, US equity indices, and global macro markets.