USD/JPY Price Forecast: 50-day SMA caps recovery near 158.00
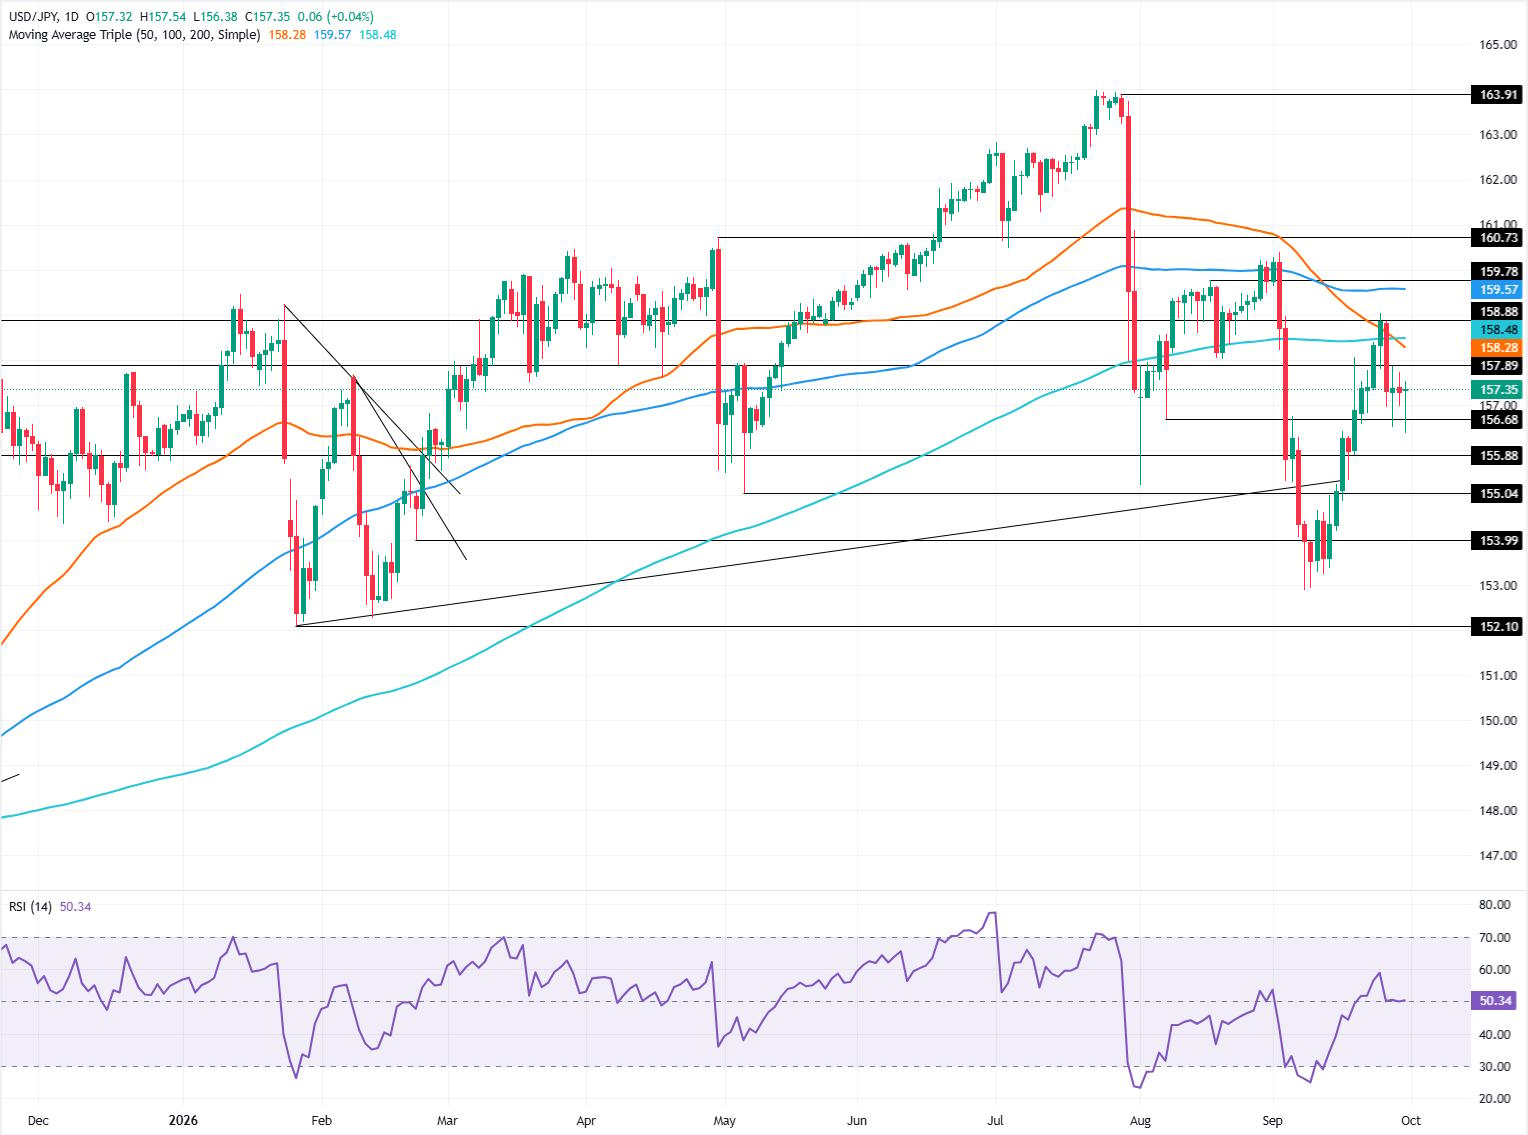
- USD/JPY steadies near 157.40 as post-intervention recovery loses momentum.
- RSI retreats toward neutral, pointing to further consolidation ahead.
- Break above 158.28 exposes 159.00, 159.57 and 160.00 next.

The USD/JPY registers modest gains of 0.08% on Wednesday after US inflation data trimmed market bets on a Federal Reserve rate hike at the October 28 meeting. At the time of writing, the pair trades at 157.42.
USD/JPY Price Forecast: Technical Outlook
Price action shows that USD/JPY is neutral to downward-biased, following the last intervention by US and Japanese authorities, which pushed the pair from around 160.00 to 153.00 before recovering some ground to the current exchange rate.
Momentum favoured buyers, but recently sellers have stepped in as the Relative Strength Index (RSI) peaked at 60 before reversing to the 50-neutral level, indicating that further consolidation lies ahead.
For a bullish continuation, the pair must climb above the 50-day Simple Moving Average (SMA) at 158.28. Above the next resistance is 159.00, followed by the 100-day SMA at 159.57. UP next lies 160.00.
On the flip side, if USD/JPY dives below the low of the day (LOD) of 156.38, it opens the door to challenge 156.00. A breach of the latter will expose the May 6 low of 155.04, followed by the September 8 low of 152.89.
USD/JPY Price Chart – Daily
Japanese Yen Price This Month
The table below shows the percentage change of Japanese Yen (JPY) against listed major currencies this month. Japanese Yen was the strongest against the New Zealand Dollar.
| USD | EUR | GBP | JPY | CAD | AUD | NZD | CHF | |
|---|---|---|---|---|---|---|---|---|
| USD | 2.53% | 2.13% | -1.49% | 2.73% | 3.17% | 4.97% | 3.35% | |
| EUR | -2.53% | -0.37% | -3.92% | 0.16% | 0.64% | 2.41% | 0.82% | |
| GBP | -2.13% | 0.37% | -3.57% | 0.54% | 1.01% | 2.78% | 1.21% | |
| JPY | 1.49% | 3.92% | 3.57% | 4.26% | 4.75% | 6.51% | 5.02% | |
| CAD | -2.73% | -0.16% | -0.54% | -4.26% | 0.48% | 2.17% | 0.65% | |
| AUD | -3.17% | -0.64% | -1.01% | -4.75% | -0.48% | 1.74% | 0.19% | |
| NZD | -4.97% | -2.41% | -2.78% | -6.51% | -2.17% | -1.74% | -1.54% | |
| CHF | -3.35% | -0.82% | -1.21% | -5.02% | -0.65% | -0.19% | 1.54% |
The heat map shows percentage changes of major currencies against each other. The base currency is picked from the left column, while the quote currency is picked from the top row. For example, if you pick the Japanese Yen from the left column and move along the horizontal line to the US Dollar, the percentage change displayed in the box will represent JPY (base)/USD (quote).
Author

Christian Borjon Valencia
FXStreet
Markets analyst, news editor, and trading instructor with over 14 years of experience across FX, commodities, US equity indices, and global macro markets.

















