- USD/INR rises for the fourth consecutive day on hawkish Fed.
- Two-week-old ascending trend channel may test the bulls, sellers need 74.55 breakout to keep reins.
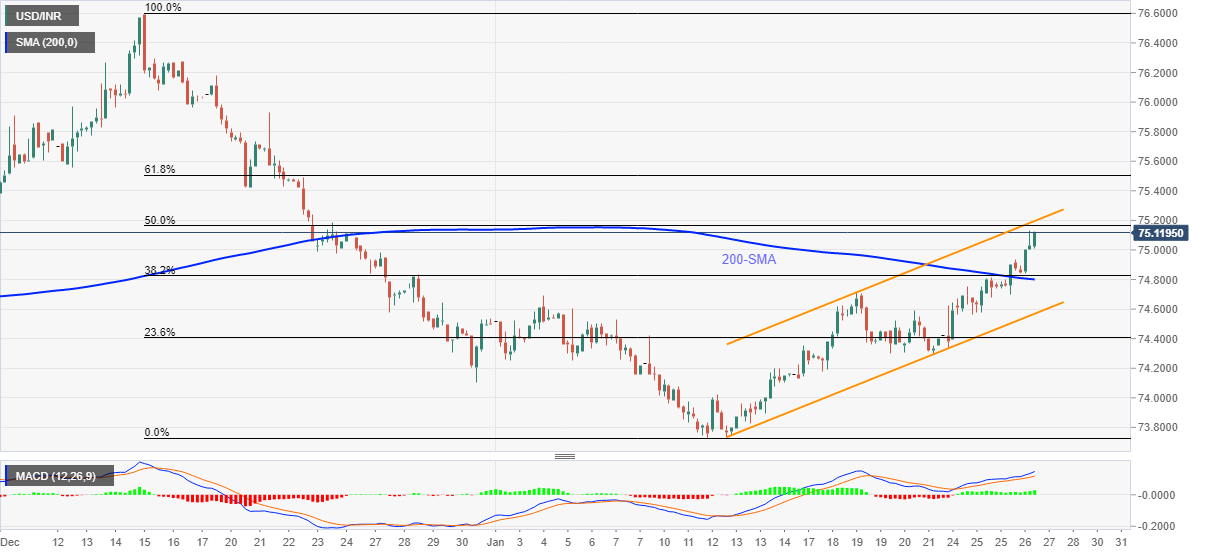
- Firmer MACD signals, a clear break of 200-SMA favor bulls.
USD/INR stays firmer at the highest levels in five weeks around 75.12 during Thursday’s Asian session.
The Indian rupee (INR) pair renewed multi-day high during the early hours of trading in Asia as US dollar bulls cheered the Federal Reserve’s (Fed) hawkish halt. The greenback strength helped USD/INR prices to rise further beyond the 200-SMA.
Read: Fed Quick Analysis: Three dovish moves boost stocks, why more could come, why the dollar could rise
As the MACD signal joins firmer prices past the key moving average, USD/INR bulls are likely to keep the reins.
However, the resistance line of a fortnight-long ascending trend channel joins the 50% Fibonacci retracement (Fibo.) of December-January downside near 75.20 to portray a short-term key resistance for the USD/INR bulls.
Should the quote rise past $75.20, further upside towards the 61.8% Fibo. level and late December swing high, respectively around 75.50 and 75.90, will be in focus.
Alternatively, pullback moves remain less worrisome until staying beyond 200-SMA and 38.2% Fibonacci retracement level, close to 74.80.
Following that, the support line of the stated bullish channel, close to 74.55, will be crucial to watch for USD/INR bears as a break of which can recall sub-74.00 area to the chart.
USD/INR: Four-hour chart
Trend: Further upside expected
Information on these pages contains forward-looking statements that involve risks and uncertainties. Markets and instruments profiled on this page are for informational purposes only and should not in any way come across as a recommendation to buy or sell in these assets. You should do your own thorough research before making any investment decisions. FXStreet does not in any way guarantee that this information is free from mistakes, errors, or material misstatements. It also does not guarantee that this information is of a timely nature. Investing in Open Markets involves a great deal of risk, including the loss of all or a portion of your investment, as well as emotional distress. All risks, losses and costs associated with investing, including total loss of principal, are your responsibility. The views and opinions expressed in this article are those of the authors and do not necessarily reflect the official policy or position of FXStreet nor its advertisers. The author will not be held responsible for information that is found at the end of links posted on this page.
If not otherwise explicitly mentioned in the body of the article, at the time of writing, the author has no position in any stock mentioned in this article and no business relationship with any company mentioned. The author has not received compensation for writing this article, other than from FXStreet.
FXStreet and the author do not provide personalized recommendations. The author makes no representations as to the accuracy, completeness, or suitability of this information. FXStreet and the author will not be liable for any errors, omissions or any losses, injuries or damages arising from this information and its display or use. Errors and omissions excepted.
The author and FXStreet are not registered investment advisors and nothing in this article is intended to be investment advice.
Recommended content
Editors’ Picks
How will US Dollar react to Q1 GDP data? – LIVE

The US' GDP is forecast to grow at an annual rate of 2.5% in the first quarter of the year. The US Dollar struggles to find demand as investors stay on the sidelines, while waiting to assess the impact of the US economic performance on the Fed rate outlook.
EUR/USD holds gains above 1.0700, as key US data loom

EUR/USD holds gains above 1.0700 in the European session on Thursday. Renewed US Dollar weakness offsets the risk-off market environment, supporting the pair ahead of the key US GDP and PCE inflation data.
GBP/USD extends recovery above 1.2500, awaits US GDP data

GBP/USD is catching a fresh bid wave, rising above 1.2500 in European trading on Thursday. The US Dollar resumes its corrective downside, as traders resort to repositioning ahead of the high-impact US advance GDP data for the first quarter.
Gold price edges higher amid weaker USD and softer risk tone, focus remains on US GDP

Gold price (XAU/USD) attracts some dip-buying in the vicinity of the $2,300 mark on Thursday and for now, seems to have snapped a three-day losing streak, though the upside potential seems limited.
XRP extends its decline, crypto experts comment on Ripple stablecoin and benefits for XRP Ledger

Ripple extends decline to $0.52 on Thursday, wipes out weekly gains. Crypto expert asks Ripple CTO how the stablecoin will benefit the XRP Ledger and native token XRP.