US Dollar Index Price Forecast: Bears push against two-month lows at 99.40
- The US Dollar Index hits a fresh two-month low at 99.30 as investors reassess Fed rate hike bets.
- US Retail Sales and benign inflationary figures have sent the US Dollar tumbling across the board.
- FX Analysts at BBH see the DXY supported above the 200-day SMA, at 99.15.

The US Dollar Index (DXY) extends losses for the third consecutive day on Monday, with bears testing levels at two-month lows below 99.40 during the European session. The US Dollar keeps bleeding as recent US data has prompted investors to reassess their expectations for immediate interest rate hikes by the US Federal Reserve (Fed).
US data released on Friday revealed that Retail Sales fell 0.6% in July, against market expectations of a 0.1% gain, following a 0.2% increase in June. Before that, producer and consumer price figures had shown easing inflationary pressures, and Nonfarm Payrolls revealed that US jobs fell unexpectedly in July. These numbers have prompted investors to dial back the odds for a September rate hike to 30%, from above 50% one week ago, according to data by the CME Group's FedWatch Tool.
Strategists at Brown Brothers Harriman highlight that the USD has “extended last week’s decline triggered by the downward adjustment to Fed funds rate expectations,” but stress that there was “no fresh catalyst behind today’s broad-based USD slump,” which in their view “suggests the DXY index should stabilize around its 200-day moving average.”
Technical Analysis: The 200-Day SMA is at 99.15
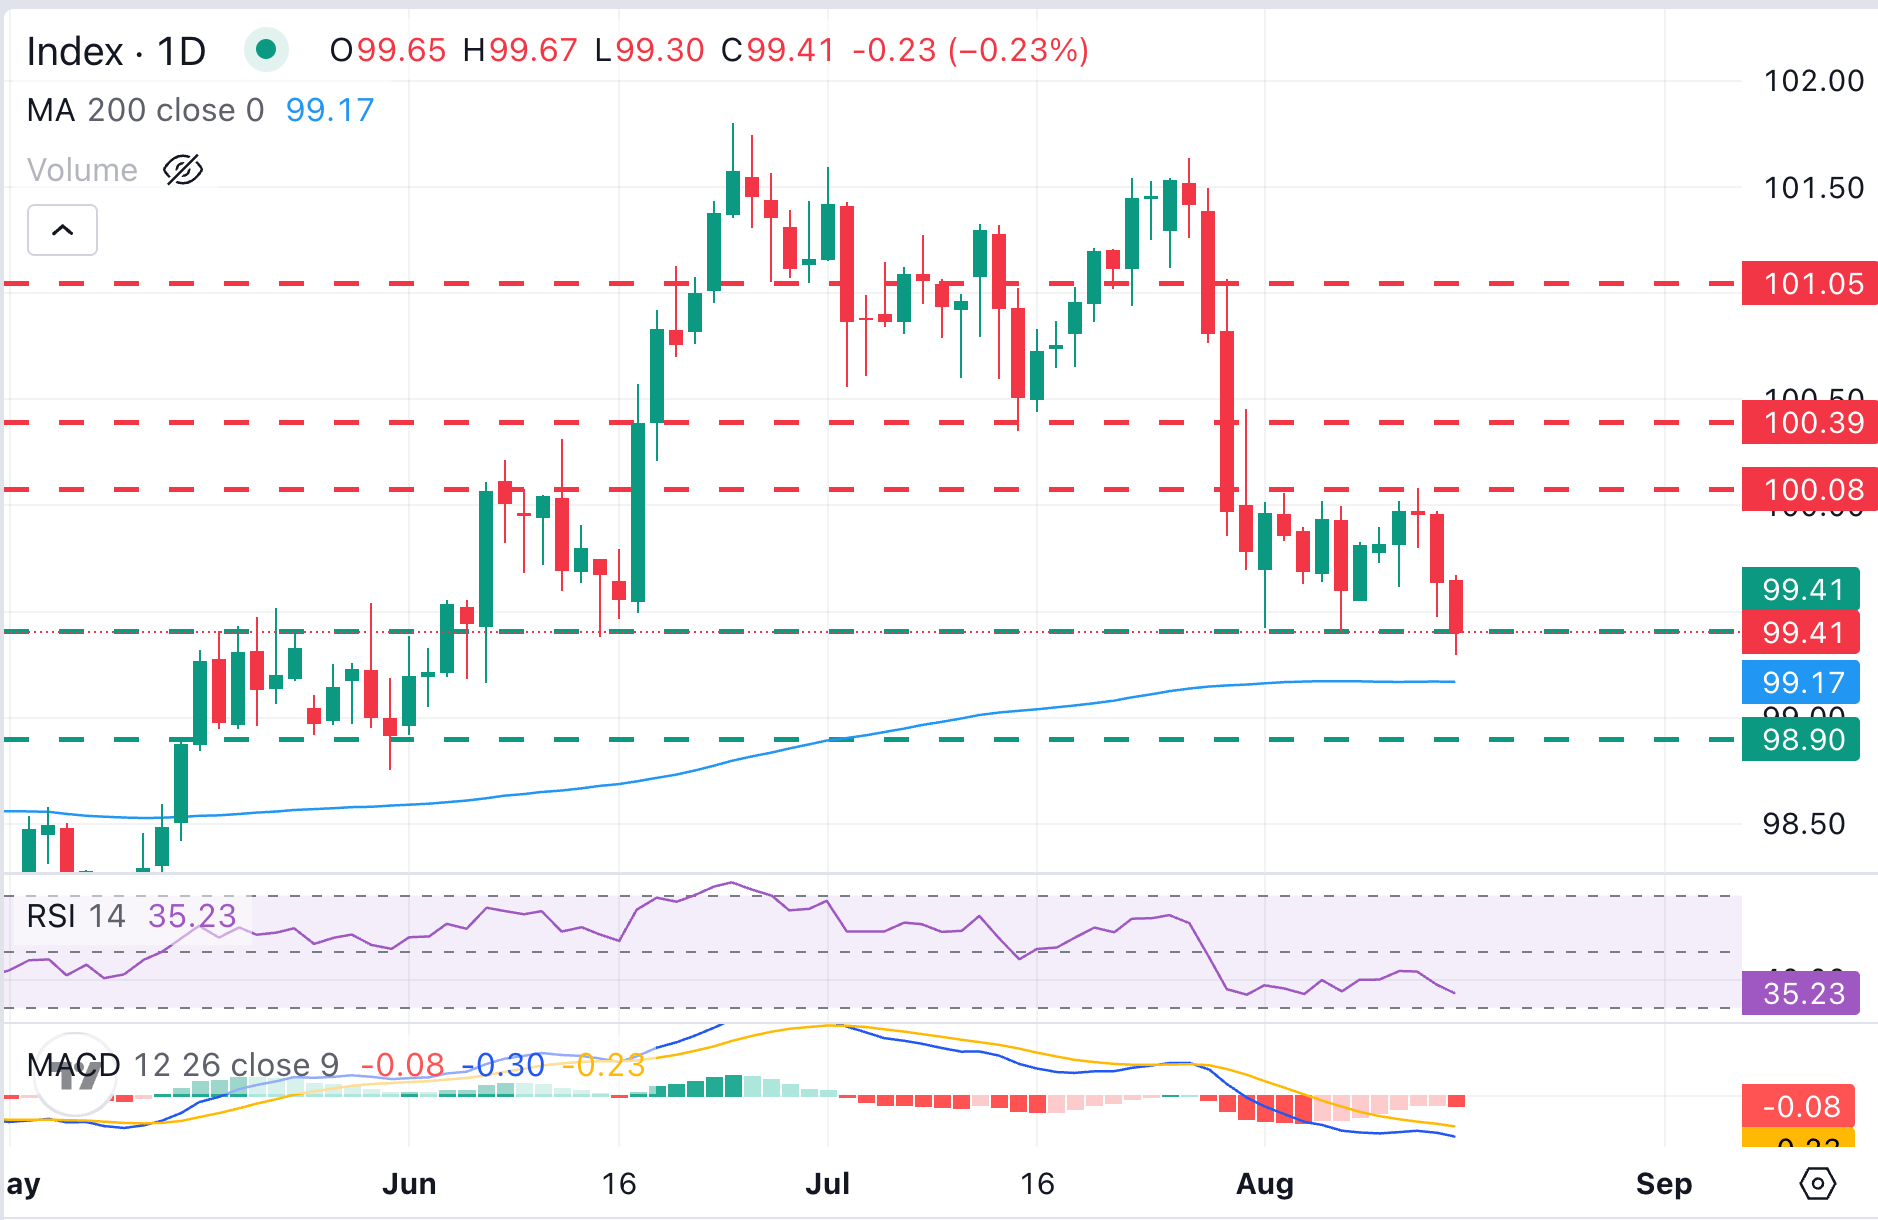
Dollar Index Spot trades at 99.40, showing a bearish near-term tone, with sellers pushing against the bottom of the last two months' trading range, looking at the 200-day SMA, at 99.15. Momentum indicators in the daily chart are pointing lower, with the Relative Strength Index (14) at 35, and the Moving Average Convergence Divergence (MACD) below zero.
On the downside, the key support area is at the mentioned 200-day SMA at 99.15. Below here, May's bottom, in the 98.75-98.90 area, is likely to hold bulls ahead of April's lows, in the 97.70 area. On the topside, a daily close above 99.40 would be the first signal of easing bearish pressure, while a stronger recovery through the 100.00 level would be needed to suggest a more durable shift back toward a constructive dollar bias.
(The technical analysis of this story was written with the help of an AI tool. Know more.)
US Dollar FAQs
The US Dollar (USD) is the official currency of the United States of America, and the ‘de facto’ currency of a significant number of other countries where it is found in circulation alongside local notes. It is the most heavily traded currency in the world, accounting for over 88% of all global foreign exchange turnover, or an average of $6.6 trillion in transactions per day, according to data from 2022. Following the second world war, the USD took over from the British Pound as the world’s reserve currency. For most of its history, the US Dollar was backed by Gold, until the Bretton Woods Agreement in 1971 when the Gold Standard went away.
The most important single factor impacting on the value of the US Dollar is monetary policy, which is shaped by the Federal Reserve (Fed). The Fed has two mandates: to achieve price stability (control inflation) and foster full employment. Its primary tool to achieve these two goals is by adjusting interest rates. When prices are rising too quickly and inflation is above the Fed’s 2% target, the Fed will raise rates, which helps the USD value. When inflation falls below 2% or the Unemployment Rate is too high, the Fed may lower interest rates, which weighs on the Greenback.
In extreme situations, the Federal Reserve can also print more Dollars and enact quantitative easing (QE). QE is the process by which the Fed substantially increases the flow of credit in a stuck financial system. It is a non-standard policy measure used when credit has dried up because banks will not lend to each other (out of the fear of counterparty default). It is a last resort when simply lowering interest rates is unlikely to achieve the necessary result. It was the Fed’s weapon of choice to combat the credit crunch that occurred during the Great Financial Crisis in 2008. It involves the Fed printing more Dollars and using them to buy US government bonds predominantly from financial institutions. QE usually leads to a weaker US Dollar.
Quantitative tightening (QT) is the reverse process whereby the Federal Reserve stops buying bonds from financial institutions and does not reinvest the principal from the bonds it holds maturing in new purchases. It is usually positive for the US Dollar.
Author

Guillermo Alcala
FXStreet
Graduated in Communication Sciences at the Universidad del Pais Vasco and Universiteit van Amsterdam, Guillermo has been working as financial news editor and copywriter in diverse Forex-related firms, like FXStreet and Kantox.

















