US Dollar Index: DXY portrays pre-data anxiety ahead of United States Core PCE Inflation
- US Dollar Index pauses two-day recovery amid sluggish markets.
- China flashes mixed signals but lackluster United States Treasury bond yields underpin cautious optimism, weigh on DXY.
- Firmer US data, President Joe Biden’s urge to tame inflation keeps US Dollar Index buyers hopeful.
- Firmer prints of Federal Reserve’s preferred inflation gauge, namely US Core PCE Price Index, needed to recall DXY bulls.


US Dollar Index (DXY) treads water around 104.40 as buyers and sellers jostle ahead of the key United States economics during early Friday. In doing so, the greenback’s gauge versus the six major currencies pauses the previous two-day uptrend amid mixed catalysts.
Bullish United States data underpin US Dollar Index run-up
On Thursday, the DXY witnessed notable gains while extending the previous day’s rebound as the United States economy expanded at an annualized rate of 3.2% in the third quarter (Q3), per the final readings of the Gross Domestic Product (GDP), versus 2.9% previous estimates. Further, the Personal Consumption Expenditure (PCE) Prices match 4.3% QoQ estimations during Q3 2022 whereas the Core PCE improved to 4.7% QoQ versus 4.6% market forecasts.
Before that, the US Conference Board’s (CB) Consumer Confidence jumped to the eight-month high of 108.3 for December, compared to the market forecasts of 101.0 and the revised prior readings of 101.40.
Hence, upbeat prints of the recently firmer US data have already renewed the DXY buying even if the greenback’s gauge versus the six major currencies struggle of late.
China probes DXY
Given the US Dollar’s safe-haven demand, the recently mixed headlines from China test the US Dollar Index traders. Recently, China's Foreign Minister Wang Yi warned US Secretary of State Antony Blinken on Friday, per Reuters, while saying that the US should not continue the 'old routine of unilateral bullying'.
On the other hand, optimism over China’s pro-growth policies and the People’s Bank of China’s (PBOC) biggest weekly cash injection in two months seemed to have favored the mildly positive sentiment previously. On the same line were the chatters surrounding Evergrande’s nearness to an offshore debt restructuring plan.
Federal Reserve’s mixed messages highlight United States Core PCE Price Index
During the last monetary policy meeting, the US Federal Reserve (Fed) failed to convince markets of its hawkish nature despite propelling the rate guidance. As a result, today’s United States Core Personal Consumption Expenditure (PCE) - Price Index, also known as the Federal Reserve’s preferred inflation gauge, becomes important to watch for the US Dollar Index traders. Additionally, the monthly Durable Goods Orders for November will also offer the one last shot of market activity before witnessing the holiday-linked inaction. Forecasts suggest that the US Core PCE Price Index remains unchanged at 0.2% MoM for November. However, the Annualized forecasts suggest softer figures of 4.7% YoY versus 5.0% previous readings. Further, US Durable Goods Orders could register a contraction of 0.6% in November compared to the previous increase of 1.1% (revised from 1.0%).
Should the scheduled data print firmer readings, the hopes of the Fed’s higher rates for a longer time can recall the US Dollar Index buyers.
US Dollar Index technical analysis
US Dollar Index seesaws around the 78.6% Fibonacci retracement level of the gauge’s May-September upside. That said, the recent rebound in the Relative Strength Index (RSI), located at 14, backed the quote’s recovery moves in the last two days, suggesting the strength of the bullish momentum, which in turn favors buyers.
However, a convergence of the 21-DMA and a one-month-old descending trend line, around 105.05, guards the quote’s immediate upside.
Following that, a run-up towards the 200-DMA and the 61.8% Fibonacci retracement, also known as the “Golden ratio”, could challenge the DXY bulls near 106.45.
If at all the US Dollar Index rises past 106.45, the bulls are likely to retake control and can aim for the 108.00 resistance confluence including the late November swing high and 50% Fibonacci retracement level.
Alternatively, a daily closing below the 78.6% Fibonacci retracement level of 104.23 could drag the DXY toward an ascending support line from May, near 103.55 by the press time.
It’s worth noting that the US Dollar’s gauge versus the six major currencies will become vulnerable to testing May’s low of 101.30 in case the bears keep the reins past 103.55.
Overall, DXY stays on the buyer’s radar unless the quote breaks 103.55.
US Dollar Index: Daily chart
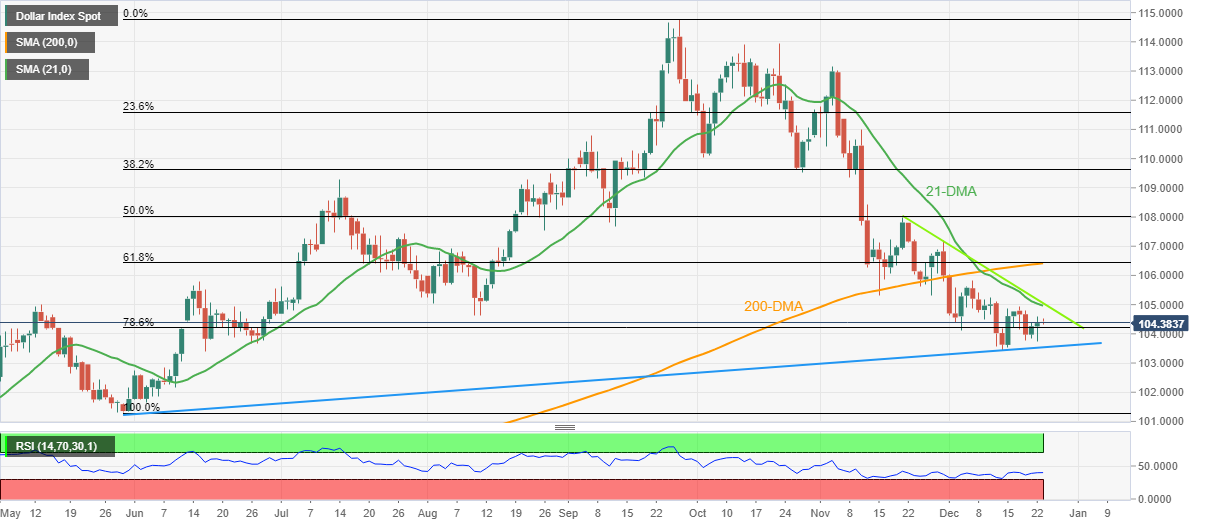
Trend: Recovery expected
Author
Anil Panchal
FXStreet
Anil Panchal has nearly 15 years of experience in tracking financial markets. With a keen interest in macroeconomics, Anil aptly tracks global news/updates and stays well-informed about the global financial moves and their implications.