Toncoin breaks free: Is the year-long downtrend finally over?

Toncoin (TON) USD just did something it hasn't managed to do in over a year—it broke above a descending resistance trendline that's been capping every rally attempt since late 2024. Currently trading at $1.8896, TON is finally showing signs that the brutal downtrend might be exhausting itself. For traders who've watched this cryptocurrency get repeatedly rejected at this trendline throughout 2025, this breakout carries real significance.
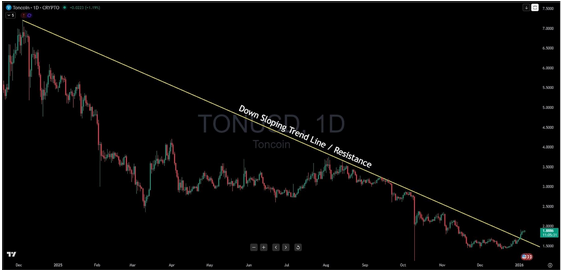
Let's unpack what's happening here. That yellow diagonal line you see cutting across the chart? That's been the boss level for TON buyers all year long. Every time price rallied toward it—and there were multiple attempts—sellers showed up and pushed it right back down. We're talking about a descent from highs above $7.00 down to lows around $1.50. That's a painful journey for anyone who bought near the top.
But then, something shifted. Price action recently started consolidating rather than collapsing further, building a base in that $1.50-$2.00 range. And now? We're sitting just above that downtrend line. This is where the story gets interesting for bulls.
If TON can hold above this breakout level—and that's the key phrase, "if it can hold"—the next meaningful resistance doesn't appear until $3.00. That's a potential 60% move from current levels. Not bad for a cryptocurrency that's spent the better part of a year getting hammered.
However, let's keep our heads on straight. Breakouts fail. They fail often, actually. What makes a breakout legitimate? Follow-through. TON needs to stay above this trendline, ideally on increasing volume, and start building higher lows. A quick spike above followed by an immediate collapse back below would be a classic bull trap, something every trader has experienced at some point.
For those considering a position, the logic is straightforward: the old resistance (that downtrend line) now needs to act as new support. If price dips back and finds buyers there, that's your confirmation. If it slices right back through like tissue paper? The breakout was false, and you need to reassess.
The risk-reward setup looks compelling if you're a swing trader. Stop loss just beneath the trendline (maybe around $1.70-$1.75 to allow for some wiggle room), and a target at $3.00. That's nearly a 2:1 reward-to-risk ratio, which meets the minimum threshold most professional traders require.
What would invalidate this bullish thesis? Simple: a decisive close back below the descending trendline, particularly on heavy selling volume. That would indicate the breakout was nothing more than a head-fake, and the path of least resistance remains lower.
Toncoin is a decentralized Layer 1 blockchain originally developed by Telegram, designed for fast transactions and scalability. It's been adopted for various decentralized applications, though like most cryptocurrencies, its price has been more influenced by broader market sentiment than fundamental developments over the past year.
The technical picture is clear: TON has a legitimate shot at extending this move higher if bulls can defend the breakout zone. But markets don't care about our wishes. They care about supply and demand. Watch how price behaves over the next few sessions. That'll tell you everything you need to know about whether this breakout has legs or if it's just another false dawn in a bear market.
Author

Benjamin Pool
Verified Investing
A seasoned financial expert with a passion for empowering individuals to mastering smart money management.


