British Pound catches second wind as soft PCE knocks Fed hike bets
- GBP/USD climbs as softer PCE flips October odds toward hold.
- UK growth beats forecasts, supporting Sterling's recovery.
- ADP strength and resilient GDP keep Fed outlook data-dependent.
The Pound Sterling (GBP) posts solid gains versus the US Dollar (USD) on Wednesday, edging up 0.42% as the latest US inflation figures were below estimates, reaffirming New York Federal Reserve (Fed) President John Williams' comments that the Fed is in no rush to tighten monetary policy. This, along with solid growth figures in the UK, boosted GBP/USD to current spot prices near 1.3280.
Sterling rallies as cooler US inflation collides with stronger UK growth
On Tuesday, several Fed officials crossed the wires, with St. Louis Fed Alberto Musalem, Chicago Fed Austan Goolsbee, and Fed Governor Michael Barr delivering hawkish remarks ahead of the Core Personal Consumption Expenditures (PCE) Price Index release, which came in below estimates and caught investors off guard, after they had priced in a Fed October hike.
US core figures in August came in at 3% YoY, below estimates of 3.3% and were unchanged from July’s print. Headline PCE stood at 3.4% YoY, unchanged from the previous number and also below forecasts for a 3.7% jump.
Other data showed that the US economy grew 2.2% in the final reading for the second quarter of 2026, exceeding forecasts of 1.5%, while ADP jobs data showed private companies hired over 90K people in September, above the 70K forecast, indicating a solid labor market.
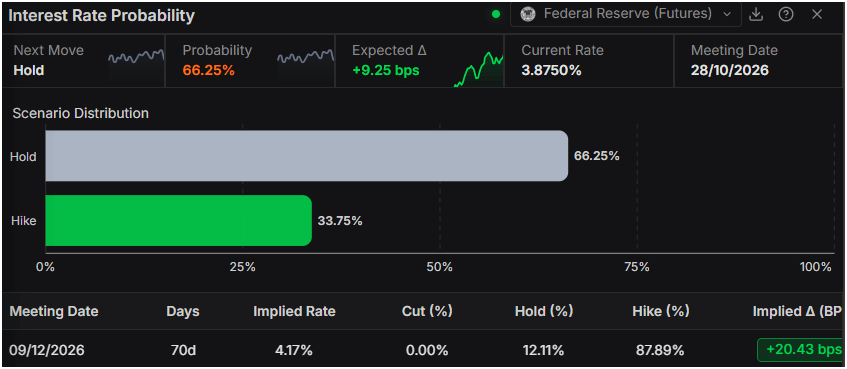
Against this backdrop, money markets shifted from expecting a rate hike to a hold for the October 28 meeting. The odds stand at 66% for a hold and nearly 34% for a rate hike, according to Prime Terminal.
The Greenback fell after the data, and the US Dollar Index (DXY), which tracks the buck’s performance versus six currencies, is down 0.08% to 101.29.
In the UK, the Office for National Statistics (ONS) reported that GDP improved to 0.5% QoQ in Q2, up from the expected 0.4%, following 0.4% growth in Q1. Although the news provides some relief for Pound buyers, traders' focus is on fiscal policy as they await Prime Minister Andy Burnham's Autumn Budget, as well as his openness to a potential “rejoin” of the European Union.
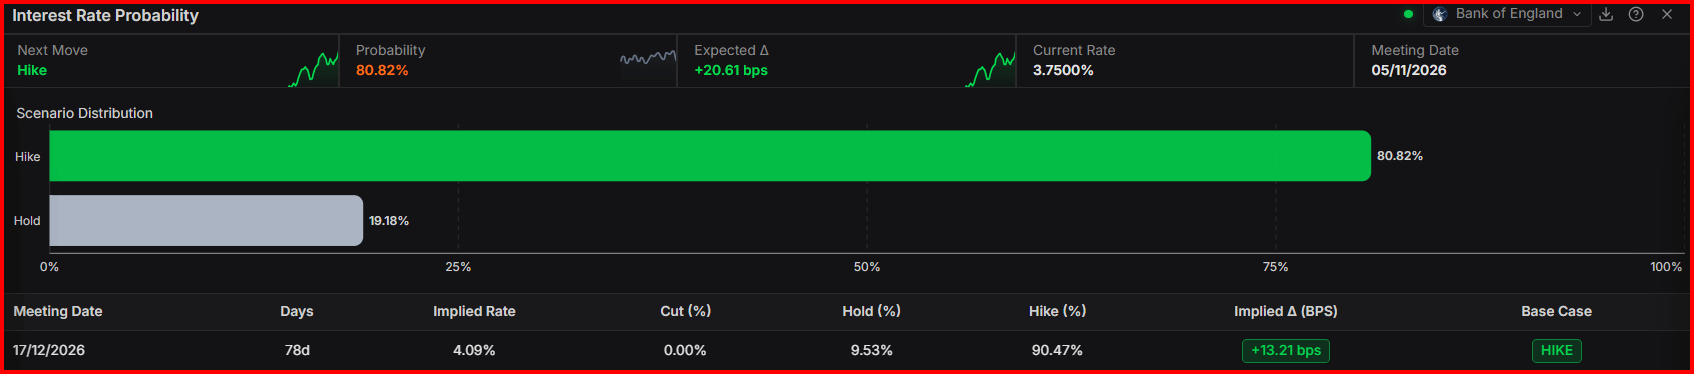
Money markets are pricing in near 33 basis points of tightening from the Bank of England towards the end of 2026 and more than 100 basis points by the end of the next year,
GBP/USD Price Forecast: Technical outlook
In the daily chart, GBP/USD trades at 1.3278, extending a bearish tone as the pair holds below the cluster of longer-term simple moving averages (SMAs) grouped around 1.3457 and under multiple broken trend-line levels now acting as overhead supply. The Relative Strength Index (14) at 36.5 hovers just above oversold territory, hinting that downside momentum remains in place but is no longer as aggressive as in prior sessions.
On the topside, initial resistance emerges at the downward trend-line break near 1.3318, with the more significant cap formed by the confluence of a resistance trend line around 1.3437 and the triple SMA cluster near 1.3457. Above that, the former upward support trend lines, now turned resistance at approximately 1.3536 and 1.3738, delineate the next barriers for any corrective bounce, while the absence of clearly defined nearby supports below the market leaves the pair vulnerable to further declines until a new base is established.
(The technical analysis of this story was written with the help of an AI tool. Know more.)
Pound Sterling Price This Month
The table below shows the percentage change of British Pound (GBP) against listed major currencies this month. British Pound was the strongest against the New Zealand Dollar.
| USD | EUR | GBP | JPY | CAD | AUD | NZD | CHF | |
|---|---|---|---|---|---|---|---|---|
| USD | 2.29% | 2.05% | -1.62% | 2.47% | 2.98% | 4.78% | 3.26% | |
| EUR | -2.29% | -0.22% | -3.84% | 0.16% | 0.68% | 2.43% | 0.94% | |
| GBP | -2.05% | 0.22% | -3.63% | 0.38% | 0.90% | 2.67% | 1.19% | |
| JPY | 1.62% | 3.84% | 3.63% | 4.14% | 4.68% | 6.44% | 5.02% | |
| CAD | -2.47% | -0.16% | -0.38% | -4.14% | 0.52% | 2.21% | 0.78% | |
| AUD | -2.98% | -0.68% | -0.90% | -4.68% | -0.52% | 1.74% | 0.29% | |
| NZD | -4.78% | -2.43% | -2.67% | -6.44% | -2.21% | -1.74% | -1.46% | |
| CHF | -3.26% | -0.94% | -1.19% | -5.02% | -0.78% | -0.29% | 1.46% |
The heat map shows percentage changes of major currencies against each other. The base currency is picked from the left column, while the quote currency is picked from the top row. For example, if you pick the British Pound from the left column and move along the horizontal line to the US Dollar, the percentage change displayed in the box will represent GBP (base)/USD (quote).
Author

Christian Borjon Valencia
FXStreet
Markets analyst, news editor, and trading instructor with over 14 years of experience across FX, commodities, US equity indices, and global macro markets.

















