SOX hits extreme overbought levels: What history says happens next

The recent 50% rally in the semiconductor index (SOX), with an unprecedented 18 consecutive up days, has been a sight to behold, pushing many forecasts and indicators to their limits. As such, on Friday, April 24, the 5-day and 14-day relative strength indicators (RSI5, RSI14) registered at 98.7 and 85.1, respectively.
The former has never been this high in the index’s history, whereas the latter has been exceeded only twice before: 1995 and 2011. See Figure 1 below. These are signs of a very strong rally, but they also indicate that it is very extended, with little room for further short-term gains. For example, the RSI ranges from 0 to 100.
Figure 1. Daily chart of the SOX with the RSI5 and RSI14
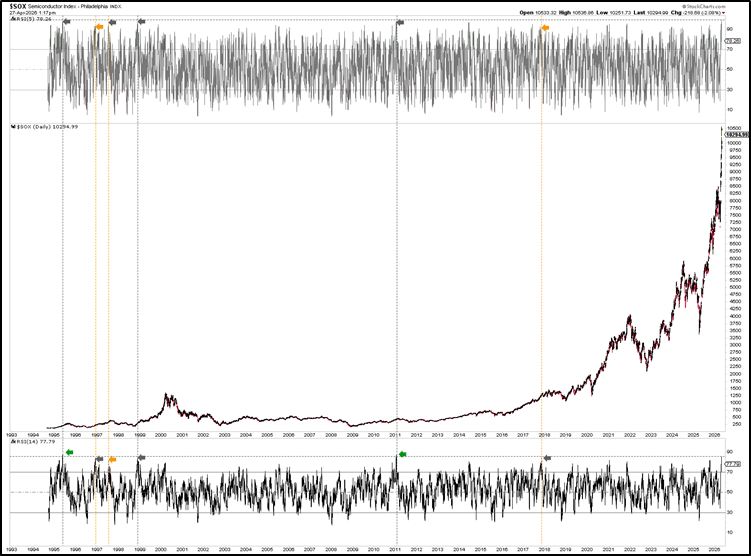
As such, we set out to assess how the index performed in prior instances with similar overbought readings, even though the daily RSI5 was at its highest level on Friday, leaving no precedent but only good analogies. Hence, we focused on the closest readings, with the daily RSI5 above 95.0 and the RSI14 above 83.5. Figure 1 shows that there have been three such instances since 1994. There were also three occasions when either the RSI5 was over 95 or the RSI14 was above 83.5, but not both, as tabulated below.
Table 1: Forward returns when the daily RSI5 and 14 are above 95 and 83.5, respectively

On all six occasions, the immediate downside risk is, on average, -7%, ranging from -5% to -11%. The intermediate-term forward return is, on average, 15%, ranging from 5% to 67%, with only one case (1998) having a negative return. Lastly, the longer-term performance (12 months out) is, on average, 8%, ranging from -40% to +80%, with only 1998 deviating from the rest. Figure 2 below shows the 1996 and 1997 forward returns
Figure 2. Forward returns for the SOX when either the RIS5 is >95 or the RSI14 is >85
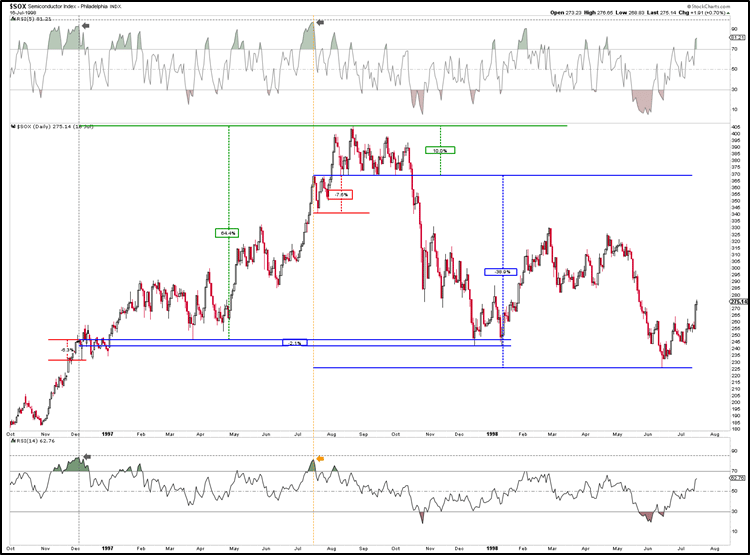
Thus, except for 1998, all other instances show a similar pattern: short-term downside risk, intermediate-term upside reward, and longer-term downside risk. If we exclude 1998, the average intermediate- and long-term returns are +25% (5 to 67%) and -26% (-39 to -2%).
This recurring pattern makes sense. The extremely high RSI readings require an immediate reset before the index can move higher again. However, these extreme readings also occur at terminal moves, e.g., 5th waves in the Elliott Wave (EW). Meanwhile, the extreme readings and resets are often (smaller) 3rd- and 4th-wave events. See Figure 3 below.
Figure3. Daily chart of the SOX with Elliott Wave Count
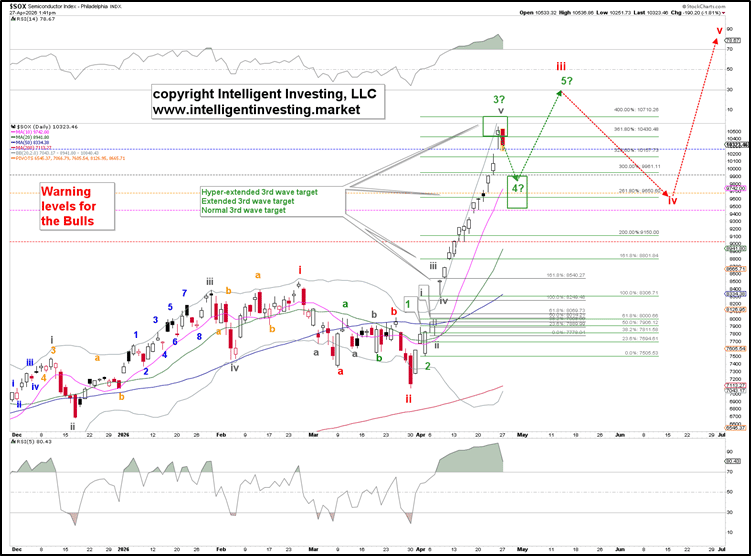
Our EW count shows the index has likely completed a 3rd of a 3rd wave: green W-3 of red W-iii, and is now in green W-4, ideally $9700 +/- 200, before W-5 to $13,000+ can take hold. After that, a final, larger 4th and 5th wave (red W-iii and -iv) should commence before the move from the April 2025 low can be considered complete, allowing the index to enter a new bear market.
These waves align with the forward returns:
· short-term risk = green W-4.
· The more variable intermediate-term upside (weeks to months) = red W-iv and W-v.
· The consistent negative returns one year out = “a new bear market.”
As such, although past performance is no guarantee of future results, we have objective historical data that aligns with our present, albeit more subjective Elliott wave count. This is a powerful combination, giving a high likelihood to the presented outcomes.
Author

Dr. Arnout Ter Schure
Intelligent Investing, LLC
After having worked for over ten years within the field of energy and the environment, Dr.


