SMH enters the blue box: Is the next major rally about to begin?

Analysts remain constructive on semiconductors heading into the end of 2026. J.P. Morgan sees strong technology earnings and sustained AI-driven demand across the semiconductor supply chain. Moreover, VanEck believes AI infrastructure spending remains a powerful long-term catalyst for chipmakers. Therefore, this backdrop continues supporting investor interest in SMH despite recent volatility.
However, analysts also recognize growing risks after the sector’s strong advance. Morningstar currently rates SMH Neutral, reflecting a balanced view on future outperformance. Meanwhile, VanEck highlights valuation pressure, concentration risk, and sharp cyclical swings. Therefore, SMH still offers strong structural exposure, but investors should expect larger corrections along the way.
Elliott Wave outlook: SMH daily chart August 28th, 2026
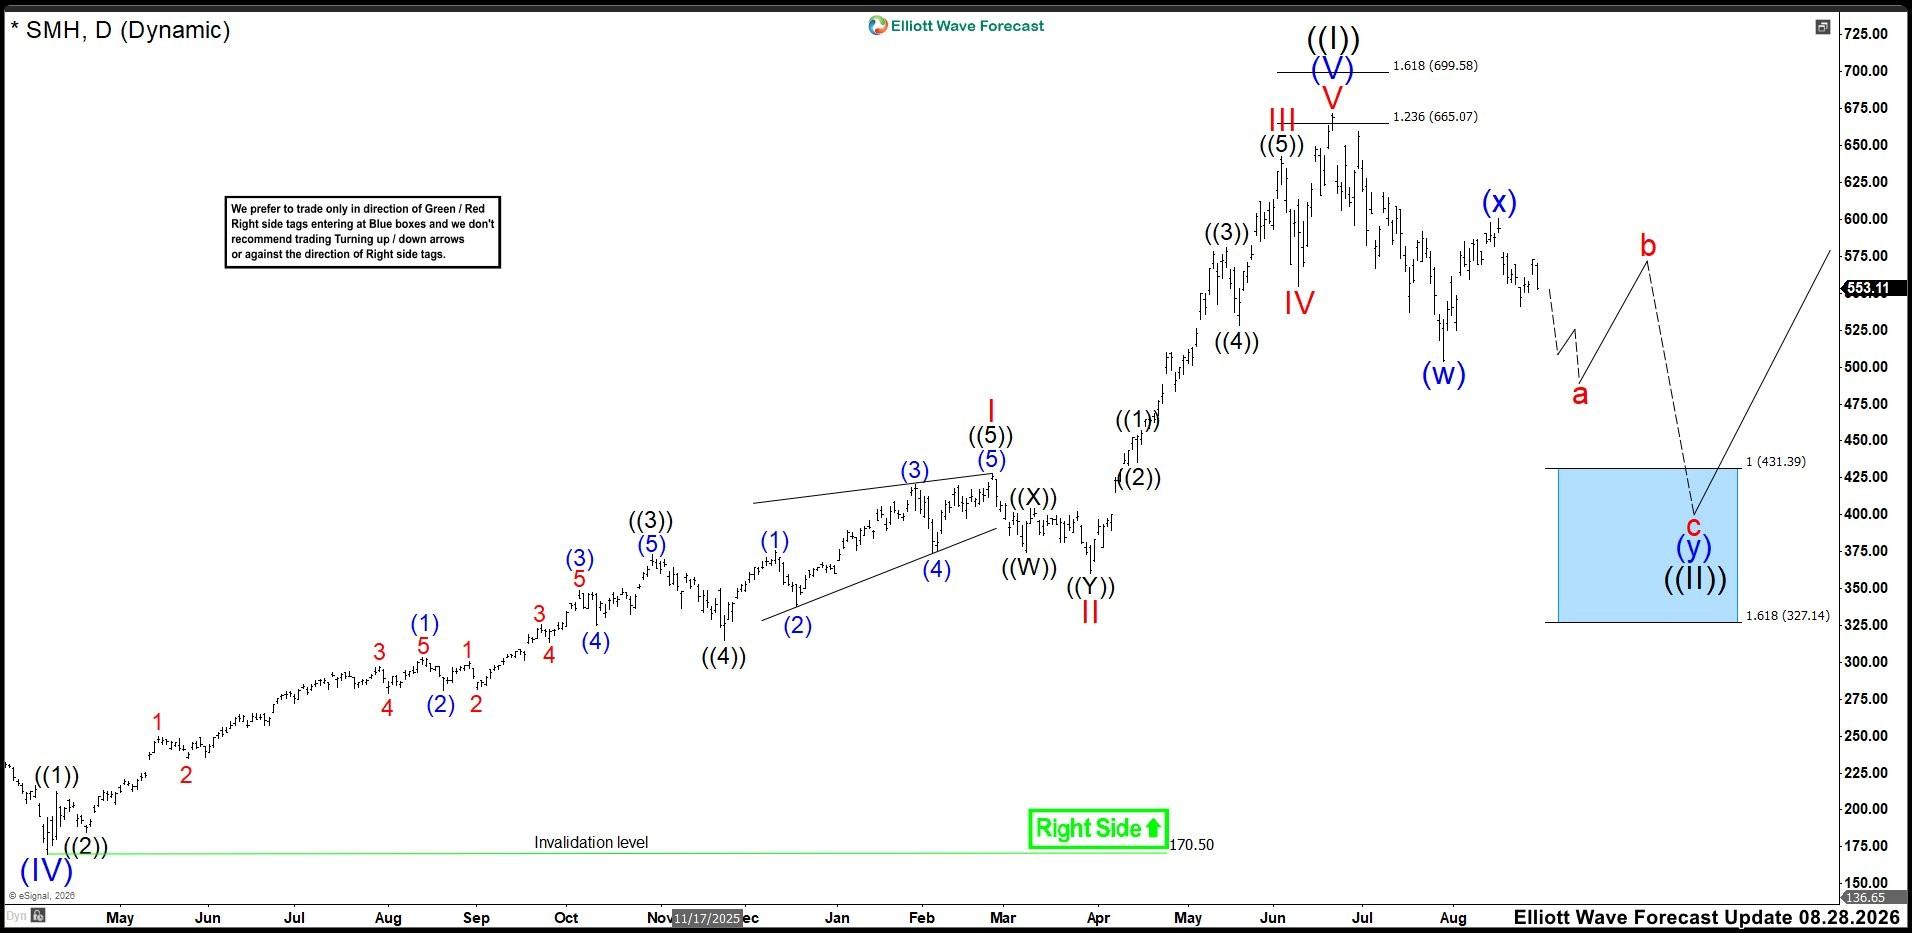
In August, we expected SMH to continue correcting the strong advance from the April 2025 low. Wave (w) had already ended, while wave (x) developed a corrective rebound. Therefore, we expected another decline through waves a-b-c to complete wave (y). That move would also complete the larger wave ((II)) correction.
Meanwhile, we expected wave b to produce a temporary recovery before sellers returned for wave c. The main downside area stood between 431.39 and 327.12. However, our larger outlook remained bullish while price held above 170.50. Therefore, we expected buyers to return after wave ((II)) ended and start the next major advance.
Elliott Wave principle behind the market structure
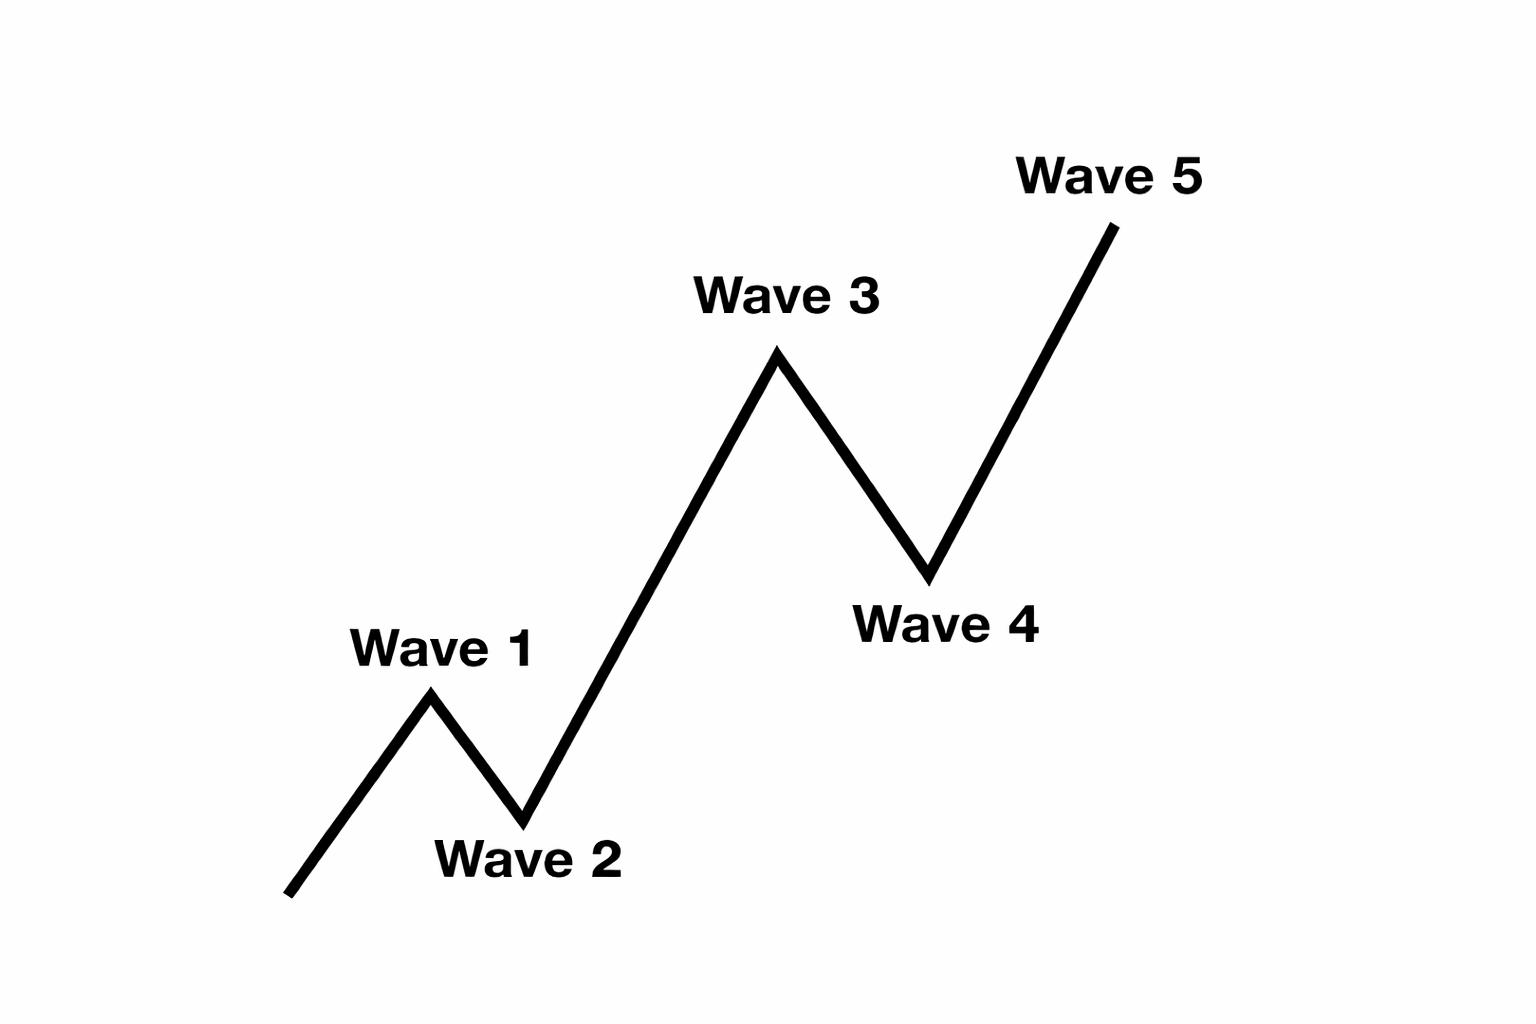
Impulse
An impulse is a clean 5‑wave pattern that drives the trend forward.
- Waves 1‑3‑5 are strong and directional.
- No overlap between waves 1 and 4.
- Wave 3 is usually the strongest.
- Structure is clear, with increasing momentum.
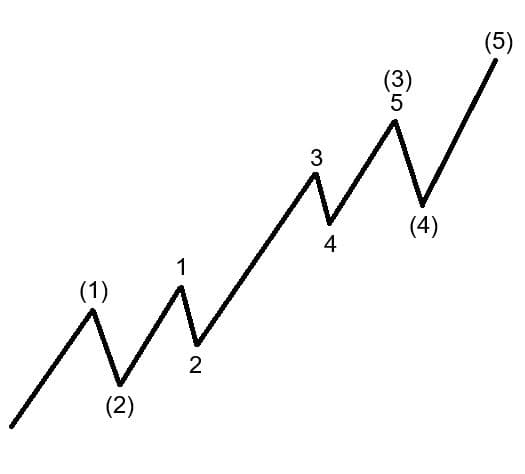
Wave extensions
Extensions occur when one impulsive wave becomes significantly longer and more powerful than the others.
Most commonly, wave 3 extends, creating the longest and most explosive leg.
An extended wave subdivides into a clear, elongated 5‑wave pattern.
The other two impulsive waves remain shorter and more proportional.
Extensions highlight where the market’s strongest momentum is concentrated.
Elliott Wave outlook: SMH daily chart November 9th, 2026
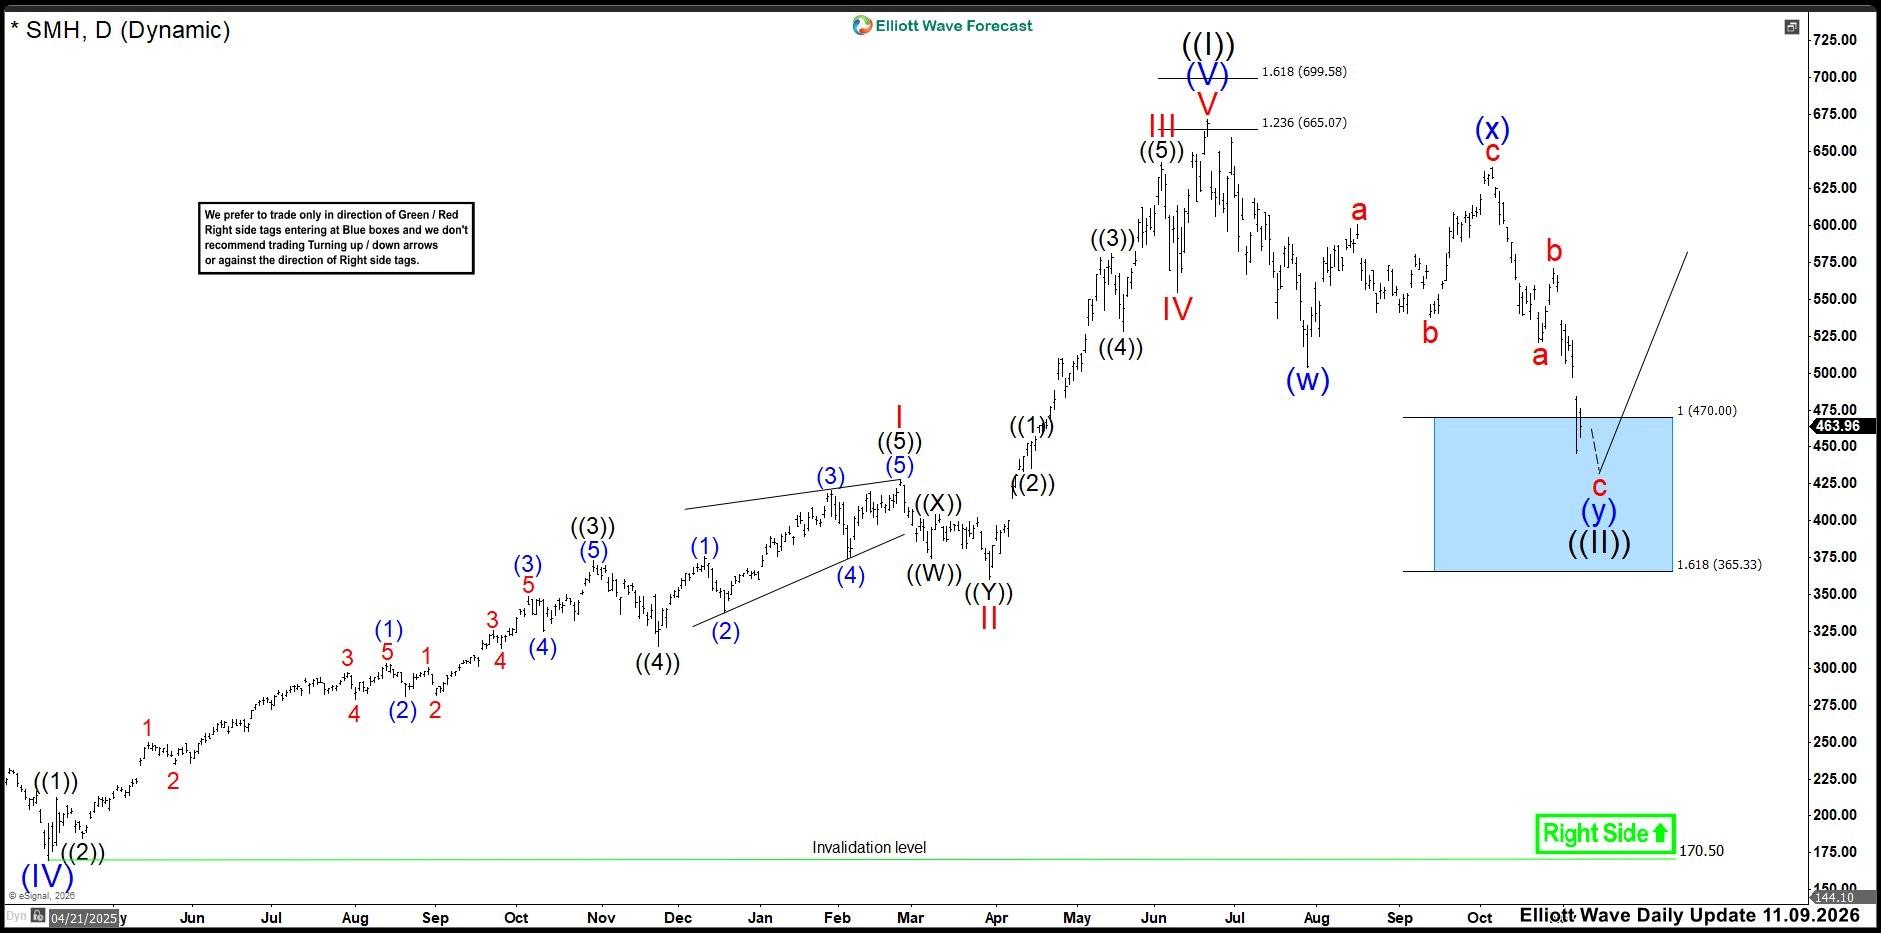
SMH has continued the correction from the June 2026 peak, while the larger bullish sequence remains intact. Wave (w) ended in August, and wave (x) completed the corrective rebound in October. Since then, sellers have started wave (y), which should complete the larger wave ((II)) correction.
Currently, SMH has already entered the 470.00–365.33 Blue Box area. Therefore, the correction can continue lower before wave ((II)) reaches completion. However, this area should attract buyers for the next major advance. As long as 170.50 holds, we expect the larger bullish sequence to resume after wave ((II)) ends.
Author

Elliott Wave Forecast Team
ElliottWave-Forecast.com