Silver Price Forecast: XAG/USD tests upper Bollinger Band while momentum remains subdued
- Silver trims earlier gains as Middle East tensions continue to drive volatility across financial markets.
- Persistent Strait of Hormuz risks keep Oil prices elevated, supporting hawkish central bank expectations.
- XAG/USD remains technically constructive above key support levels despite easing from three-week highs.

Silver (XAG/USD) trims part of its earlier gains on Thursday as geopolitical headlines from the Middle East continue to stir volatility across financial markets. At the time of writing, XAG/USD is trading around $79.62 after easing from a three-week high near $82.00 touched earlier in the American session, though the metal remains up nearly 3% on the day.
Iran has imposed new rules for vessels passing through the Strait of Hormuz, according to CNN, in an attempt to tighten control over shipping movements through the waterway, which handles 20% of global Oil flows.
Persistent tensions surrounding the Strait of Hormuz keep Oil prices elevated, fueling inflation concerns and supporting hawkish central bank expectations, which in turn continue to cap upside attempts in Silver.
However, renewed hopes that the US and Iran could reach a deal to end the war in the Middle East support the metal in the near term, while technical indicators also remain constructive.
Technical Analysis:
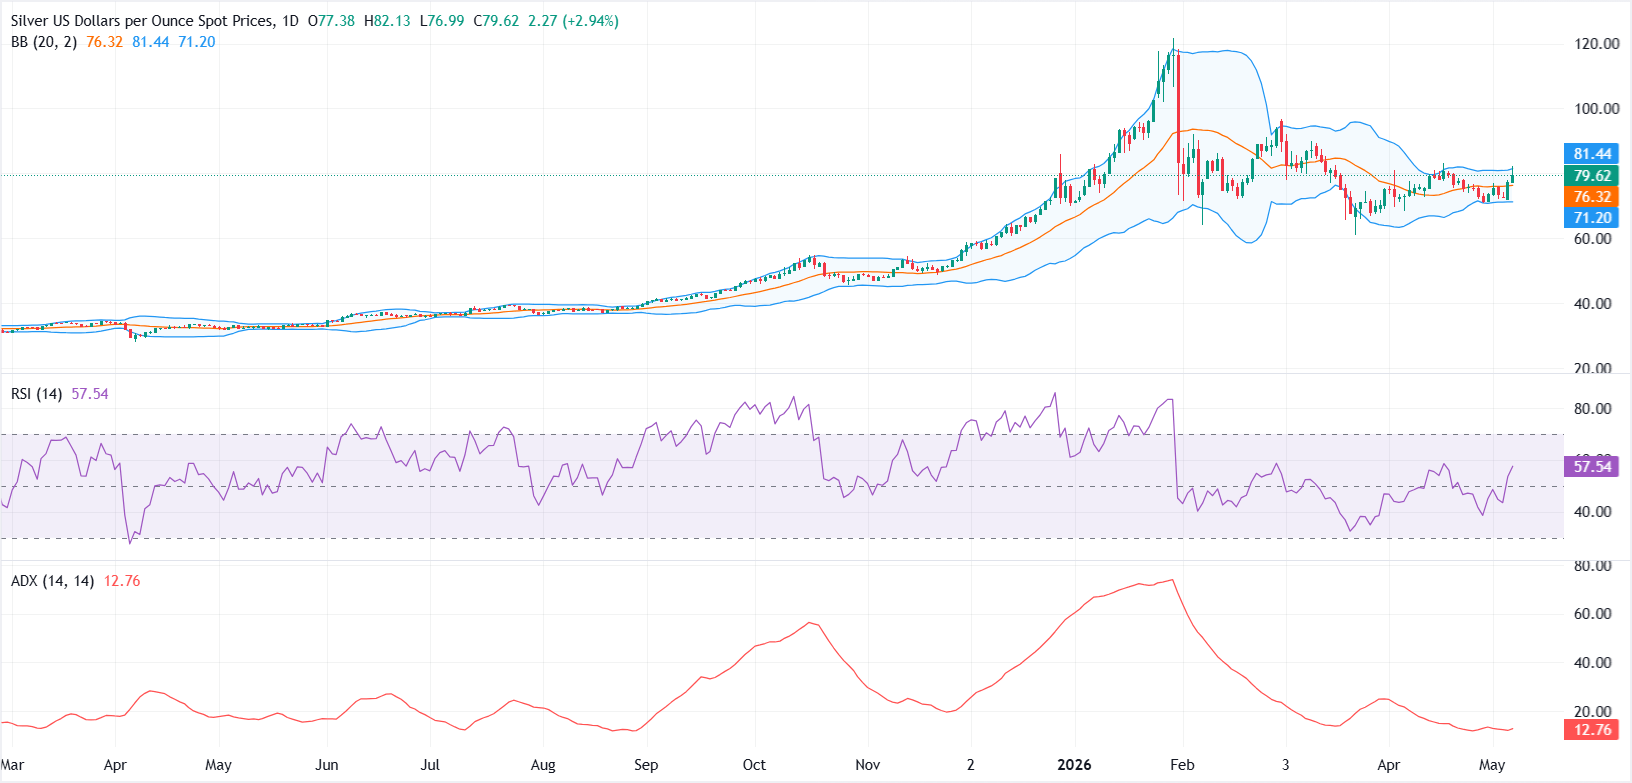
In the daily chart, XAG/USD holds above the 20-day Simple Moving Average (SMA) Bollinger middle band at $76.32, keeping the near‑term bias constructive while it grinds toward the upper Bollinger band, now capping the upside around $81.43. The Relative Strength Index (14) at 57 sits in positive territory without being overbought, suggesting buyers retain control, while the subdued Average Directional Index (14) near 12.76 hints that the prevailing uptrend lacks strong directional conviction for now.
On the topside, immediate resistance is located at the upper Bollinger band at $81.43; a daily close above this barrier would open the door for a more impulsive extension of the bull leg. On the downside, initial support is provided by the 20-day SMA Bollinger middle band at $76.32, with a deeper pullback likely finding additional protection near the lower Bollinger band around $71.21 as long as the broader bullish structure remains intact.
(The technical analysis of this story was written with the help of an AI tool.)
US Dollar Price Today
The table below shows the percentage change of US Dollar (USD) against listed major currencies today. US Dollar was the strongest against the Japanese Yen.
| USD | EUR | GBP | JPY | CAD | AUD | NZD | CHF | |
|---|---|---|---|---|---|---|---|---|
| USD | -0.01% | 0.09% | 0.25% | 0.05% | 0.10% | 0.05% | 0.02% | |
| EUR | 0.00% | 0.09% | 0.28% | 0.06% | 0.10% | 0.05% | 0.02% | |
| GBP | -0.09% | -0.09% | 0.17% | -0.04% | 0.00% | -0.04% | -0.07% | |
| JPY | -0.25% | -0.28% | -0.17% | -0.22% | -0.16% | -0.26% | -0.23% | |
| CAD | -0.05% | -0.06% | 0.04% | 0.22% | 0.06% | 0.00% | -0.03% | |
| AUD | -0.10% | -0.10% | -0.01% | 0.16% | -0.06% | -0.05% | -0.09% | |
| NZD | -0.05% | -0.05% | 0.04% | 0.26% | 0.00% | 0.05% | -0.03% | |
| CHF | -0.02% | -0.02% | 0.07% | 0.23% | 0.03% | 0.09% | 0.03% |
The heat map shows percentage changes of major currencies against each other. The base currency is picked from the left column, while the quote currency is picked from the top row. For example, if you pick the US Dollar from the left column and move along the horizontal line to the Japanese Yen, the percentage change displayed in the box will represent USD (base)/JPY (quote).
Author

Vishal Chaturvedi
FXStreet
I am a macro-focused research analyst with over four years of experience covering forex and commodities market. I enjoy breaking down complex economic trends and turning them into clear, actionable insights that help traders stay ahead of the curve.














