|

Silver Miners (SIL): Identifying the next support zone
The Global X Silver Miners ETF (SIL) provides investors with diversified exposure to leading silver mining companies across the globe. Since its launch in 2010, the fund has tracked the Solactive Global Silver Miners Total Return Index, offering a straightforward way to participate in the sector through a single trade. In the discussion that follows, we examine the ETF’s Elliott Wave technical outlook.

SIL (Silver Miners ETF) monthly Elliott Wave chart
SIL

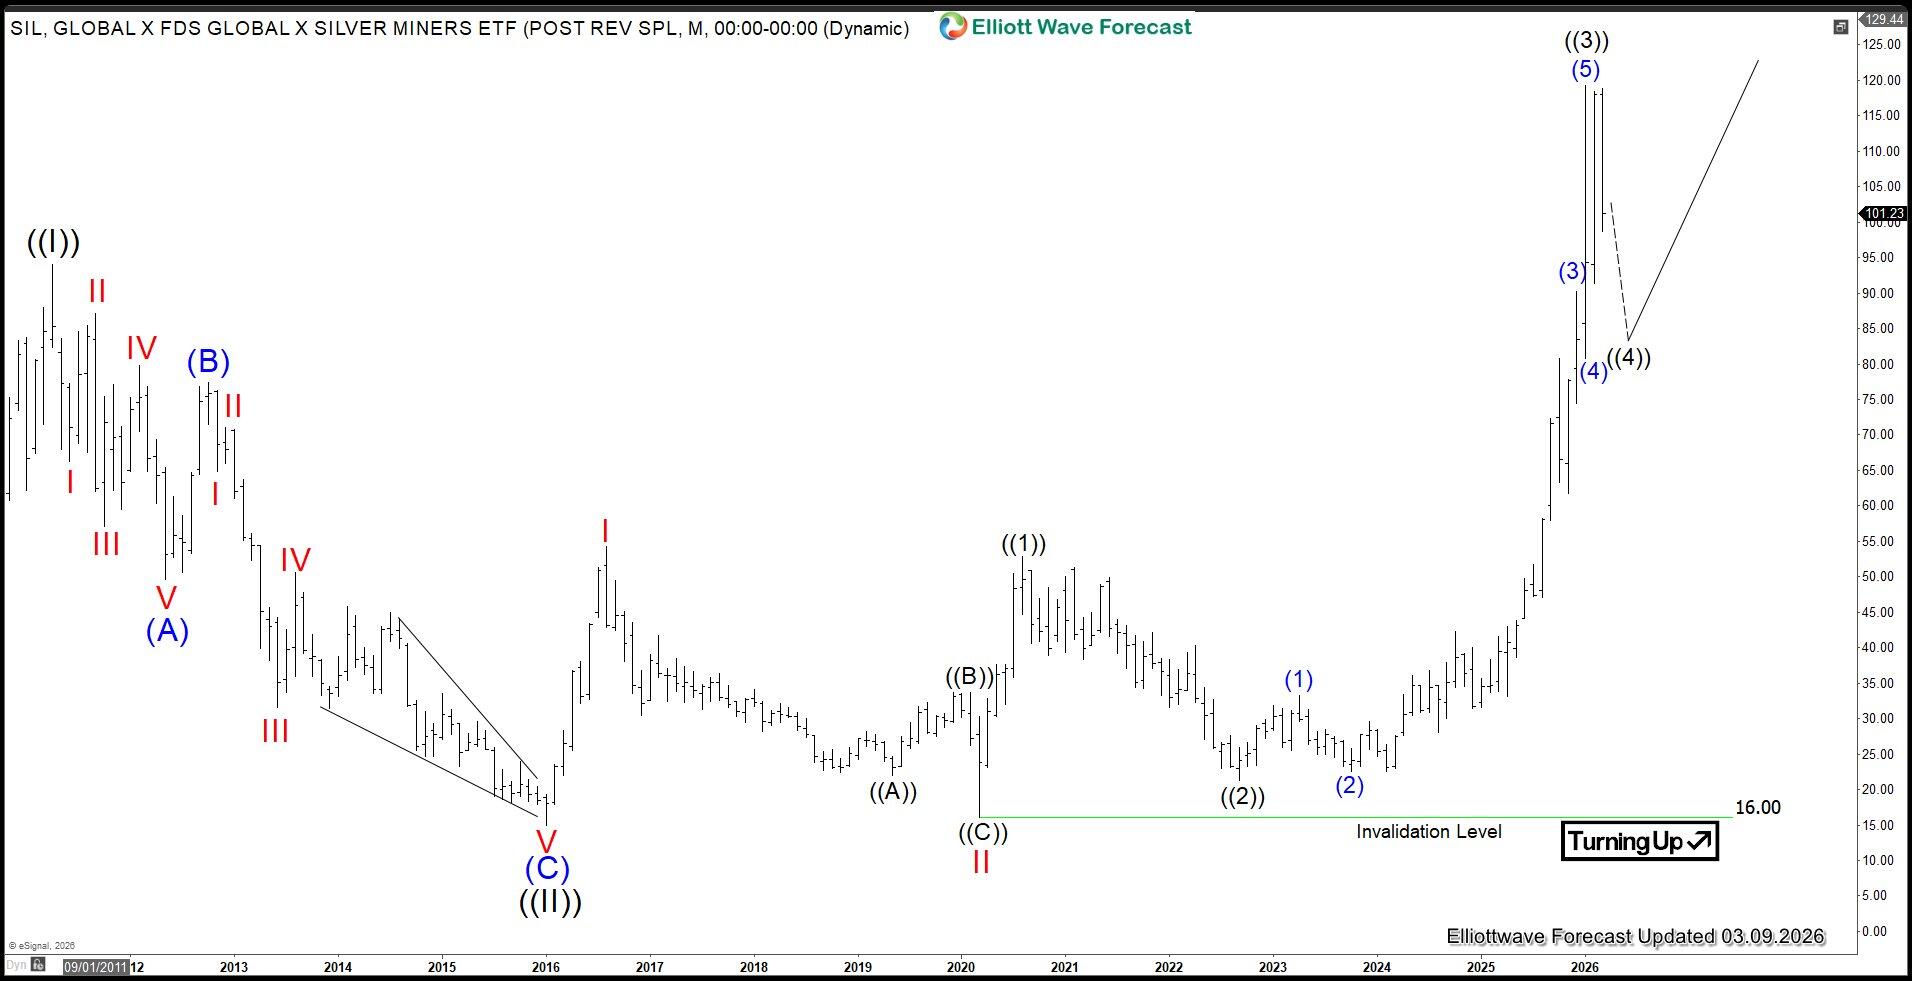
The monthly Elliott Wave chart of the Silver Miners ETF (SIL) suggests the ETF is nesting higher after completing the wave ((II)) pullback at $14.94. From that low, wave I advanced to $54.34, followed by a wave II correction down to $16. The ETF then nested higher, with wave ((1)) peaking at $52.87 and wave ((2)) retracing to $21.26.

Subsequently, wave ((3)) is proposed complete at $119.24, and the current wave ((4)) pullback is unfolding to correct the cycle from the September 2022 low before resuming higher. As long as the $16 pivot remains intact, SIL is expected to attract buyers and extend the bullish sequence.

Silver Miners ETF daily Elliott Wave chart
Chart

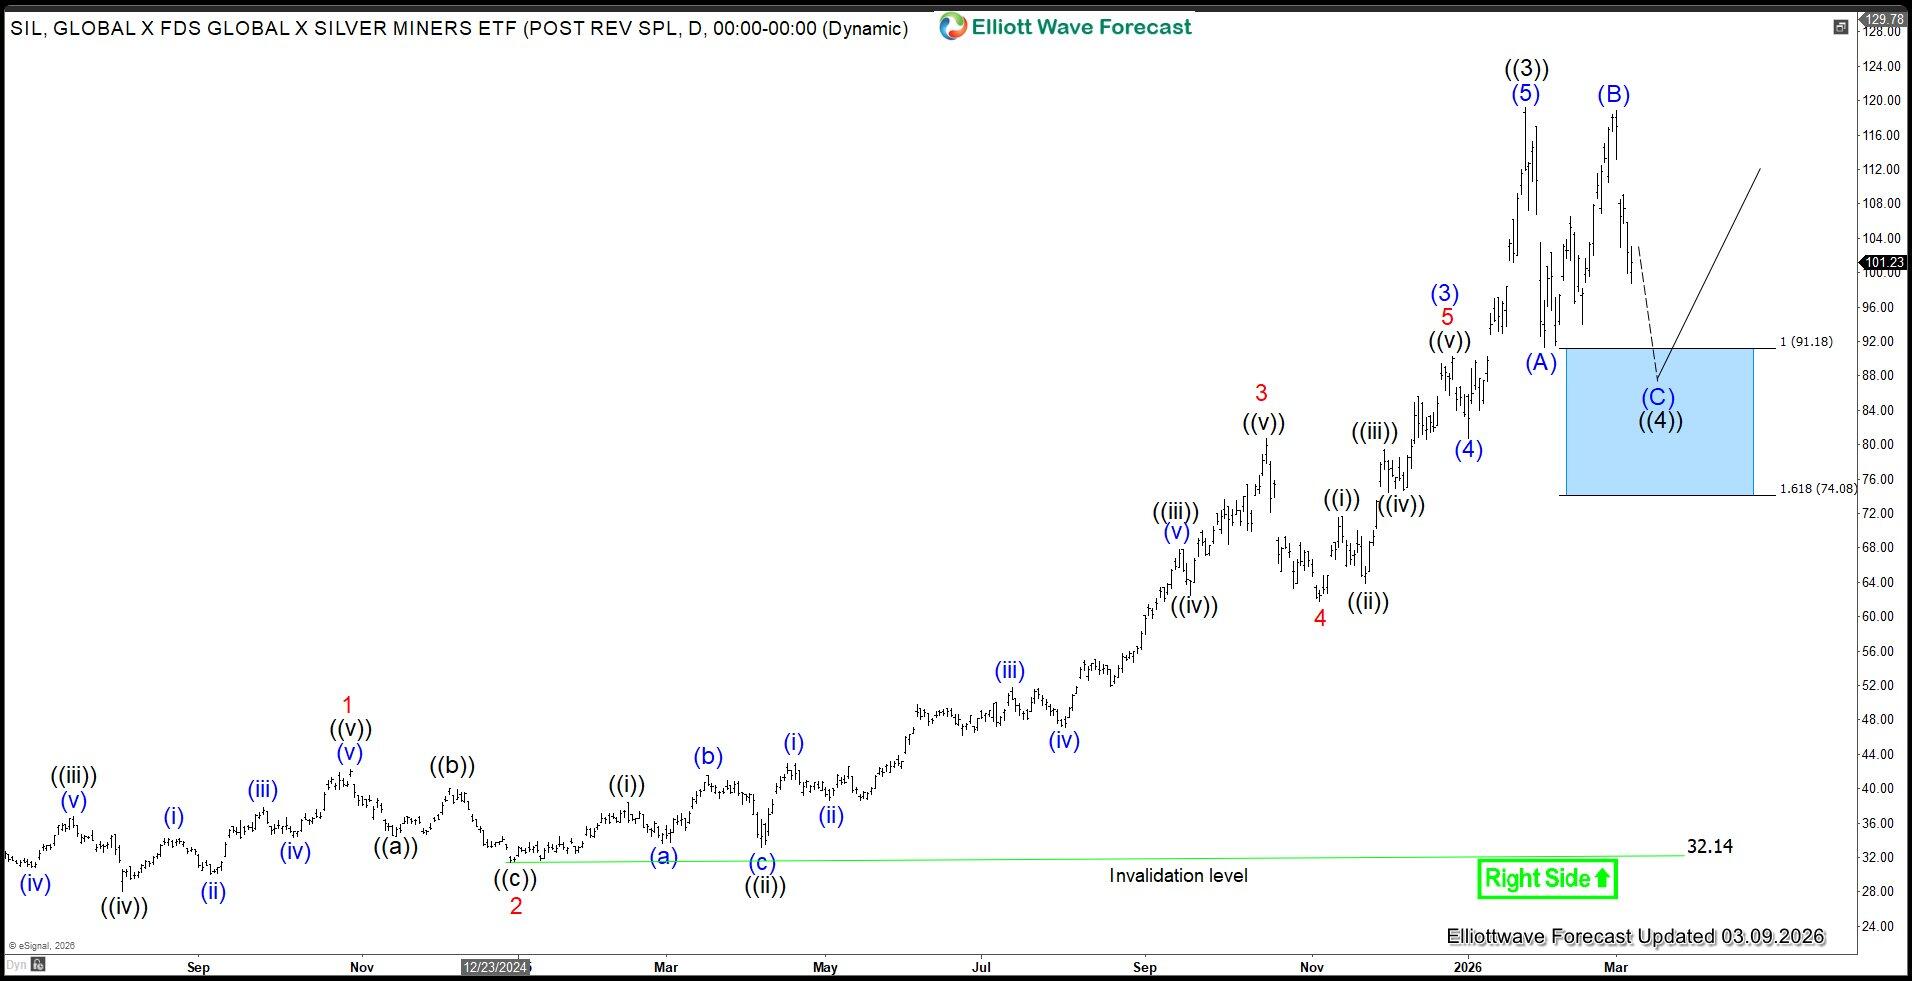
The daily Elliott Wave chart of the Silver Miners ETF (SIL) indicates that the rally to $119.24 completed wave ((3)). The ETF is now correcting the cycle from the September 2022 low in wave ((4)). The pullback is unfolding as a zigzag structure, with wave (A) ending at $91.31 and wave (B) at $118.85. Currently, wave (C) is progressing lower toward the inflection zone of $74–$91.10. Wave ((4)) is expected to complete at this area before the broader uptrend resumes.

Author

Elliott Wave Forecast Team

Elliott Wave Forecast Team

ElliottWave-Forecast.com

More from Elliott Wave Forecast Team
Share:

Editor's Picks

AUD/USD pulls back from monthly high but holds above 0.7000

AUD/USD retreats from the monthly high set earlier this Thursday, sliding back to 0.7000 during the Asian session as a further escalation of tensions in the Middle East undermines the risk-sensitive Aussie. However, recent hawkish comments from RBA officials could support the Australian Dollar. Furthermore, the prevailing US Dollar selling bias, despite Fed hike bets and geopolitical uncertainties, could limit losses for the pair.

USD/JPY declines to a one-week low; eyes trading range support near 157.50 on weaker USD

USD/JPY drops to a one-week low during Thursday’s Asian session, with bears now awaiting a break below multi-week range support near mid-157.00s before placing fresh bets amid a broadly weaker US Dollar. Despite bets for a December Fed rate hike and Middle East jitters, the recent decline in US bond yields keeps USD depressed near a three-week low. Moreover, hawkish BoJ expectations and intervention risks underpin the Japanese Yen, further weighing on the currency pair.

Gold extends fall below $4,100 as Fed hike bets counter USD weakness

Gold weakens further below $4,100, hitting a fresh one-week low as oil-driven inflation risks reinforce Fed hike bets and weigh on the bullion heading into the European session. Meanwhile, falling US bond yields keep the US Dollar depressed near a three-week low despite geopolitical uncertainties. This, however, does little to support the non-yielding bullion, backing the case for further losses.

Cardano: Weak momentum puts ADA recovery at risk

Cardano (ADA) is trading below $0.222 on Thursday after failing to sustain gains above the 50-day Exponential Moving Average near $0.228 the previous day. Weakening derivatives metrics and fading bullish momentum continue to weigh on sentiment, while a break below the 100-day EMA could push ADA lower.

Dow Jones Industrial Average climbs with the AI trade, led by a bank

The Dow Jones Industrial Average got most of its share of Wednesday's artificial intelligence (AI) rally from a bank and a bulldozer maker. The index closed near 52,800, its highest close since early September. SpaceX (SPCX) reported 161% revenue growth and the Nasdaq Composite rose more than 1%, but under price weighting the gains that counted most belonged to Goldman Sachs (GS) and Caterpillar (CAT).

The US Dollar fell. Gold didn't rally. That tells you everything
Gold (XAU/USD) is struggling to capitalize on a weaker US Dollar (USD), after repeatedly failing to establish itself above the $4,200 level. The precious metal remains confined to a relatively narrow trading range despite a combination of developments that would normally support higher prices.