Silver hits fresh YTD lows as hawkish Fed bets propel the US Dollar to over one-year highs
- Silver breaks below the $60 mark on Wednesday and hits fresh 2026 lows amid rising Fed rate-hike bets.
- The US Dollar climbs to its highest level in more than a year, adding pressure on the white metal.
- Technically, XAG/USD remains vulnerable below key SMAs, with the next support seen around $55.

Silver (XAG/USD) drops to fresh year-to-date lows on Wednesday as hawkish Federal Reserve (Fed) expectations and a stronger US Dollar (USD) keep sellers firmly in control. At the time of writing, XAG/USD trades around $59.39, its lowest level since December 2025.
The white metal has been under pressure since peaking at an all-time high of $121 in January. The correction has been driven by profit-taking following last year's 148% rally. Later, the correction accelerated as the US-Iran conflict-driven energy shock reignited inflation concerns and prompted traders to abandon expectations of Fed rate cuts this year, sending US Treasury yields higher.
The latest leg lower comes after the Fed delivered a hawkish hold at last week's monetary policy meeting, leading markets to price in the possibility of a rate hike later this year.
According to the CME FedWatch Tool, traders currently see a 70% chance that the Fed will raise borrowing costs in September. As a non-yielding asset, Silver tends to perform better in a lower interest-rate environment.
The hawkish repricing has pushed the US Dollar to its highest levels in more than a year. The US Dollar Index (DXY), which tracks the Greenback against a basket of six major currencies, is trading around 101.69, its highest level since May 2025.
The break below the $60 mark suggests buyers have lost control of a support area that had repeatedly contained declines earlier this year, increasing the risk of a deeper correction in the precious metal.
Even so, with no major US economic releases scheduled for Wednesday, traders may refrain from placing aggressive bearish bets ahead of the Personal Consumption Expenditures (PCE) Price Index report due on Thursday.
Hotter-than-expected data could reinforce expectations of tighter monetary policy and extend Silver's losses, while softer inflation figures could provide some relief and stabilize the metal.
Technical Analysis:
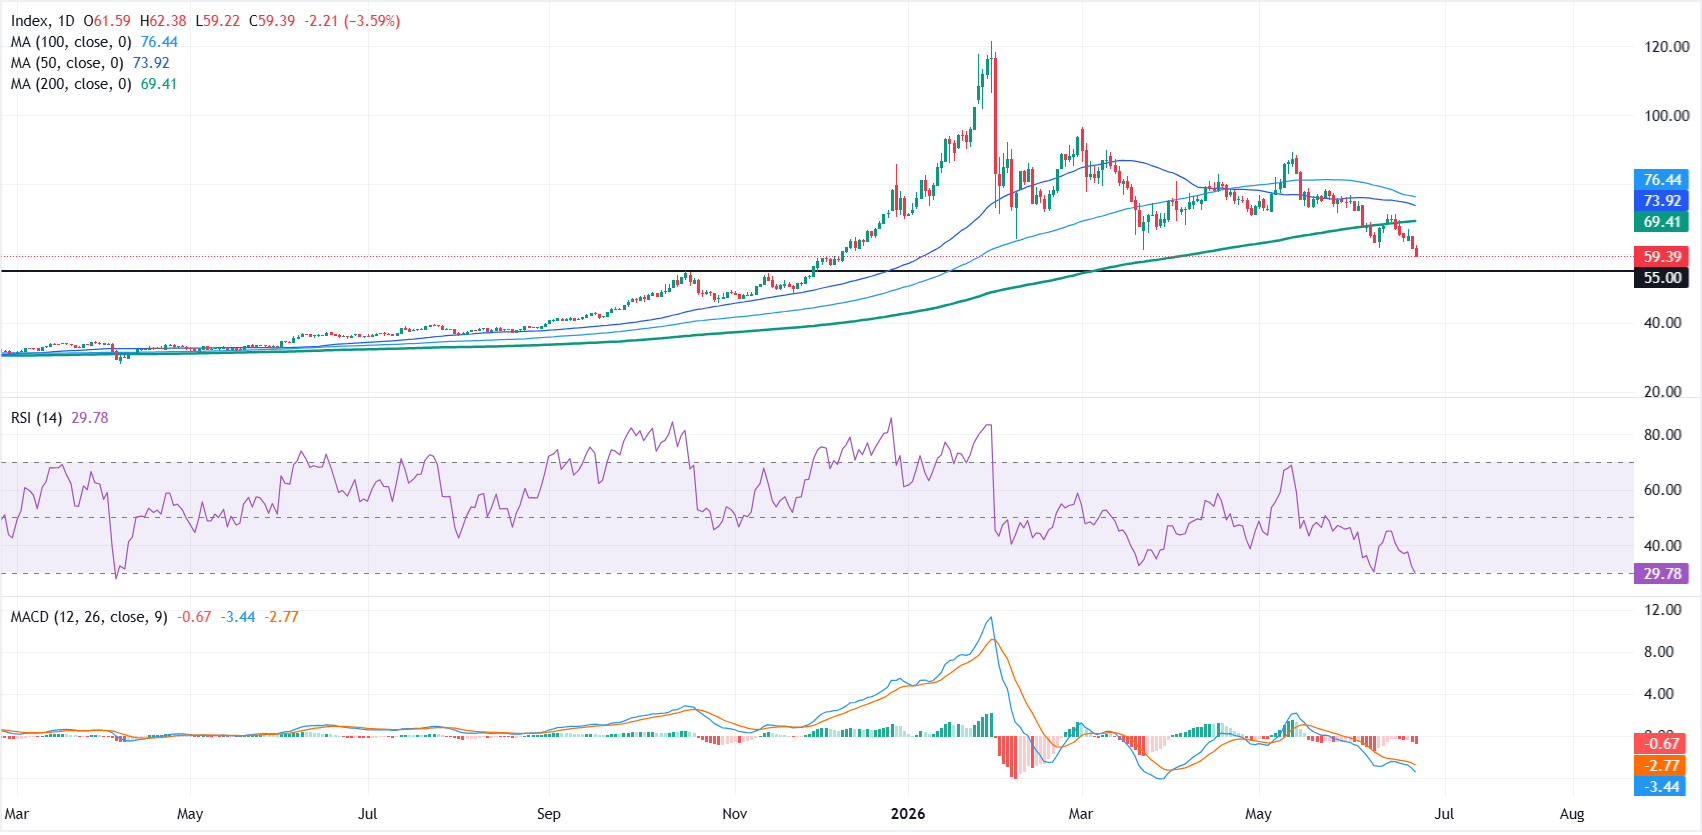
On the daily chart, XAG/USD maintains a bearish near-term bias, with price trading well below the 50-day, 100-day and 200-day Simple Moving Averages (SMAs).
The Relative Strength Index (RSI) at 29.61 slips into oversold territory while the Moving Average Convergence Divergence (MACD) remains negative, which together hint that downside momentum is stretched but still dominant as long as silver stays capped below these primary trend gauges.
On the topside, initial resistance is located at the 200-day SMA near $69.41, ahead of a denser supply zone defined by the 50-day SMA at $73.92 and the 100-day SMA at $76.44.
On the downside, sustained trading below $60 would open the door to a deeper decline toward the next support level near $55.
(The technical analysis of this story was written with the help of an AI tool.)
Silver FAQs
Silver is a precious metal highly traded among investors. It has been historically used as a store of value and a medium of exchange. Although less popular than Gold, traders may turn to Silver to diversify their investment portfolio, for its intrinsic value or as a potential hedge during high-inflation periods. Investors can buy physical Silver, in coins or in bars, or trade it through vehicles such as Exchange Traded Funds, which track its price on international markets.
Silver prices can move due to a wide range of factors. Geopolitical instability or fears of a deep recession can make Silver price escalate due to its safe-haven status, although to a lesser extent than Gold's. As a yieldless asset, Silver tends to rise with lower interest rates. Its moves also depend on how the US Dollar (USD) behaves as the asset is priced in dollars (XAG/USD). A strong Dollar tends to keep the price of Silver at bay, whereas a weaker Dollar is likely to propel prices up. Other factors such as investment demand, mining supply – Silver is much more abundant than Gold – and recycling rates can also affect prices.
Silver is widely used in industry, particularly in sectors such as electronics or solar energy, as it has one of the highest electric conductivity of all metals – more than Copper and Gold. A surge in demand can increase prices, while a decline tends to lower them. Dynamics in the US, Chinese and Indian economies can also contribute to price swings: for the US and particularly China, their big industrial sectors use Silver in various processes; in India, consumers’ demand for the precious metal for jewellery also plays a key role in setting prices.
Silver prices tend to follow Gold's moves. When Gold prices rise, Silver typically follows suit, as their status as safe-haven assets is similar. The Gold/Silver ratio, which shows the number of ounces of Silver needed to equal the value of one ounce of Gold, may help to determine the relative valuation between both metals. Some investors may consider a high ratio as an indicator that Silver is undervalued, or Gold is overvalued. On the contrary, a low ratio might suggest that Gold is undervalued relative to Silver.
Author

Vishal Chaturvedi
FXStreet
I am a macro-focused research analyst with over four years of experience covering forex and commodities market. I enjoy breaking down complex economic trends and turning them into clear, actionable insights that help traders stay ahead of the curve.


