|

Semiconductor Index rally faces Elliott Wave resistance as next pullback targets emerge

In our June 9 update on the semiconductor index (SOX), we found, using the Elliott Wave Principle (EWP), that

“With the red Wave-iii complete and exceeding the 161.80% level at $13,336 by 662p, we can now expect the red W-iv, which often targets the (blue) 100.0%, to stall ~662p north of it ($9,523 + $662 = $10,185), which aligns with the $10,390-11,490 target zone shown in Figure 1. After four comes five, so the red W-v, ideally to $15,000 +/- $1,000, is still pending”

Fast-forward to today: the index bottomed at $11,794 on June 9 and peaked at $14,655 on June 22. See Figure 1 below. Thus, the series of updates we’ve presented for the SOX using forward returns and the EWP since late April remains on track.

Figure 1. Daily chart of the SOX with our intermediate-term Elliott Wave Count
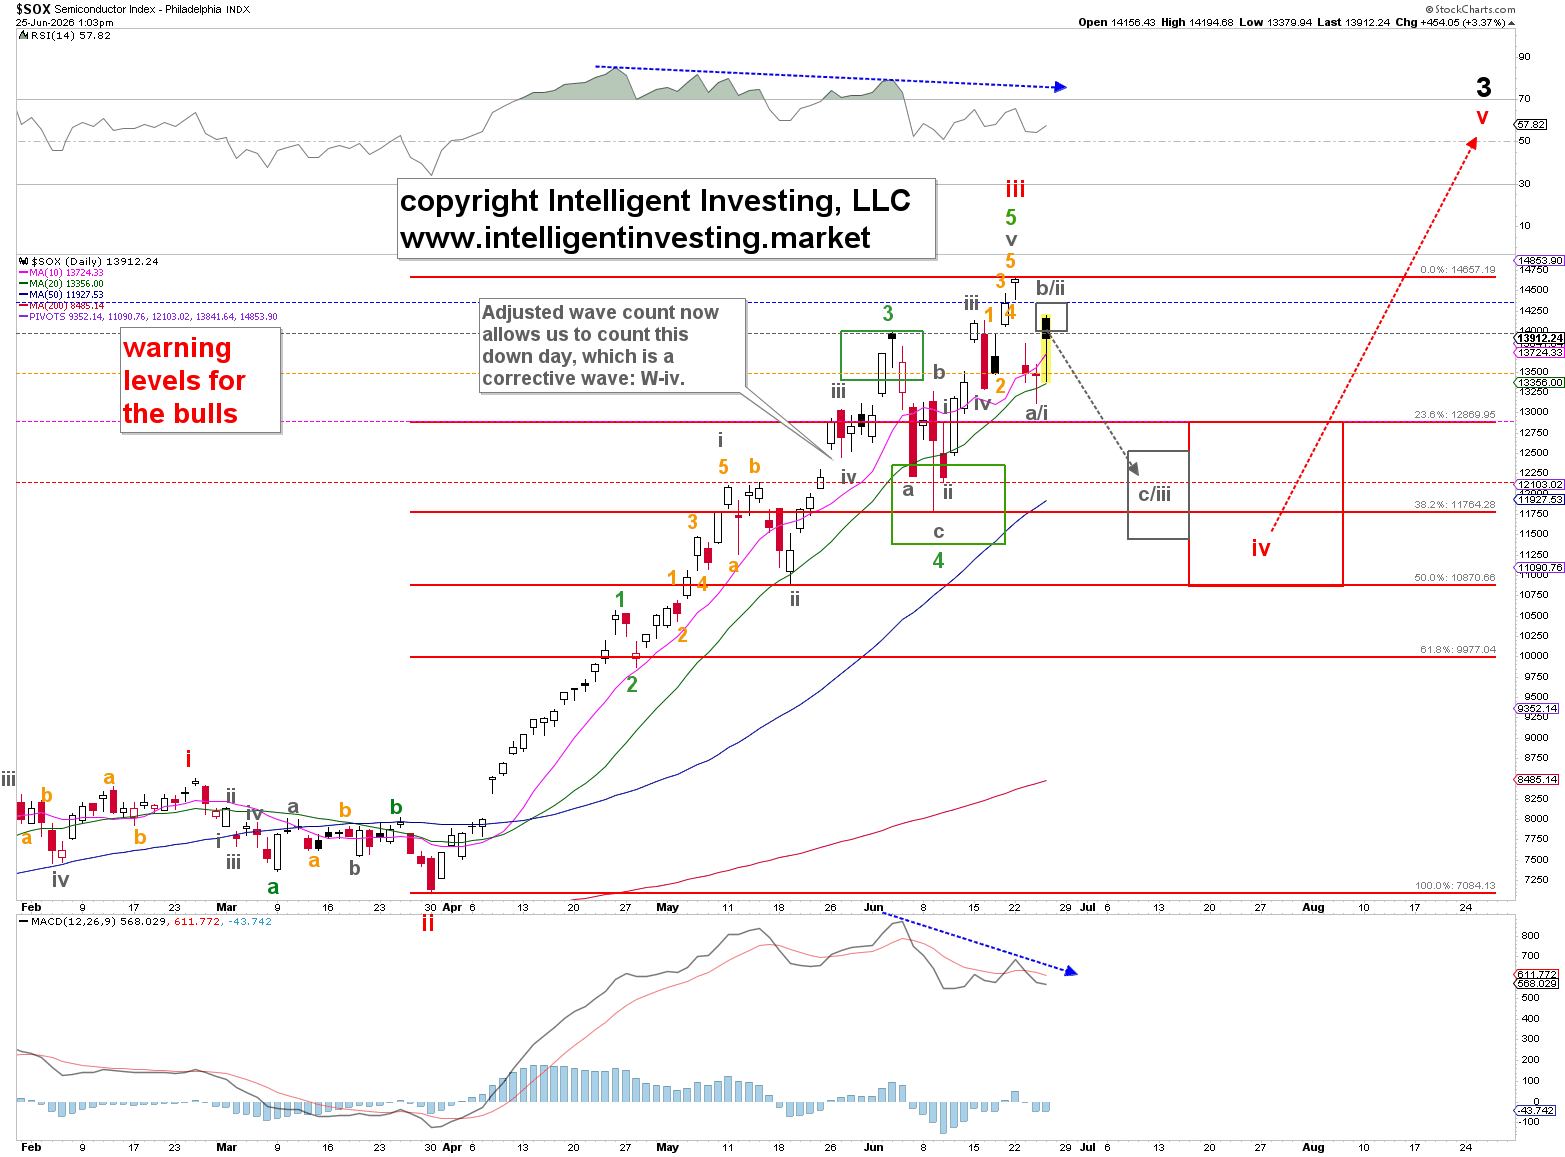
Although the correction hit the numbers, it was too brief to count as an intermediate-degree 4th wave (red W-iv), so we have updated the wave count by one degree. As such, the June 22 high is now labeled red W-iii, and red W-iv is now underway, ideally targeting $10,870 - $11,765. Nothing to worry about. It is essentially just nomenclature, aka “potato vs. potato,” but we do want to remain informative and objective.

Zooming in, we can count five waves lower from the June 22 red W-iii high for the gray wave-a/i. See Figure 2 below. A three-legged bounce (orange W-a, b, c) is now underway, with a common c=a target at the $14,472 gap. From around that level, ideally, we expect the next leg lower, W-iii/c, to commence to ~$12,000-12,900 depending on the relationship between W-c/iii and W-a/i (c/iii = 1.618x a/i or c/iii = a/i), which we simply cannot know beforehand.

Figure 2. 65-min chart of the SOX with our short-term Elliott Wave Count
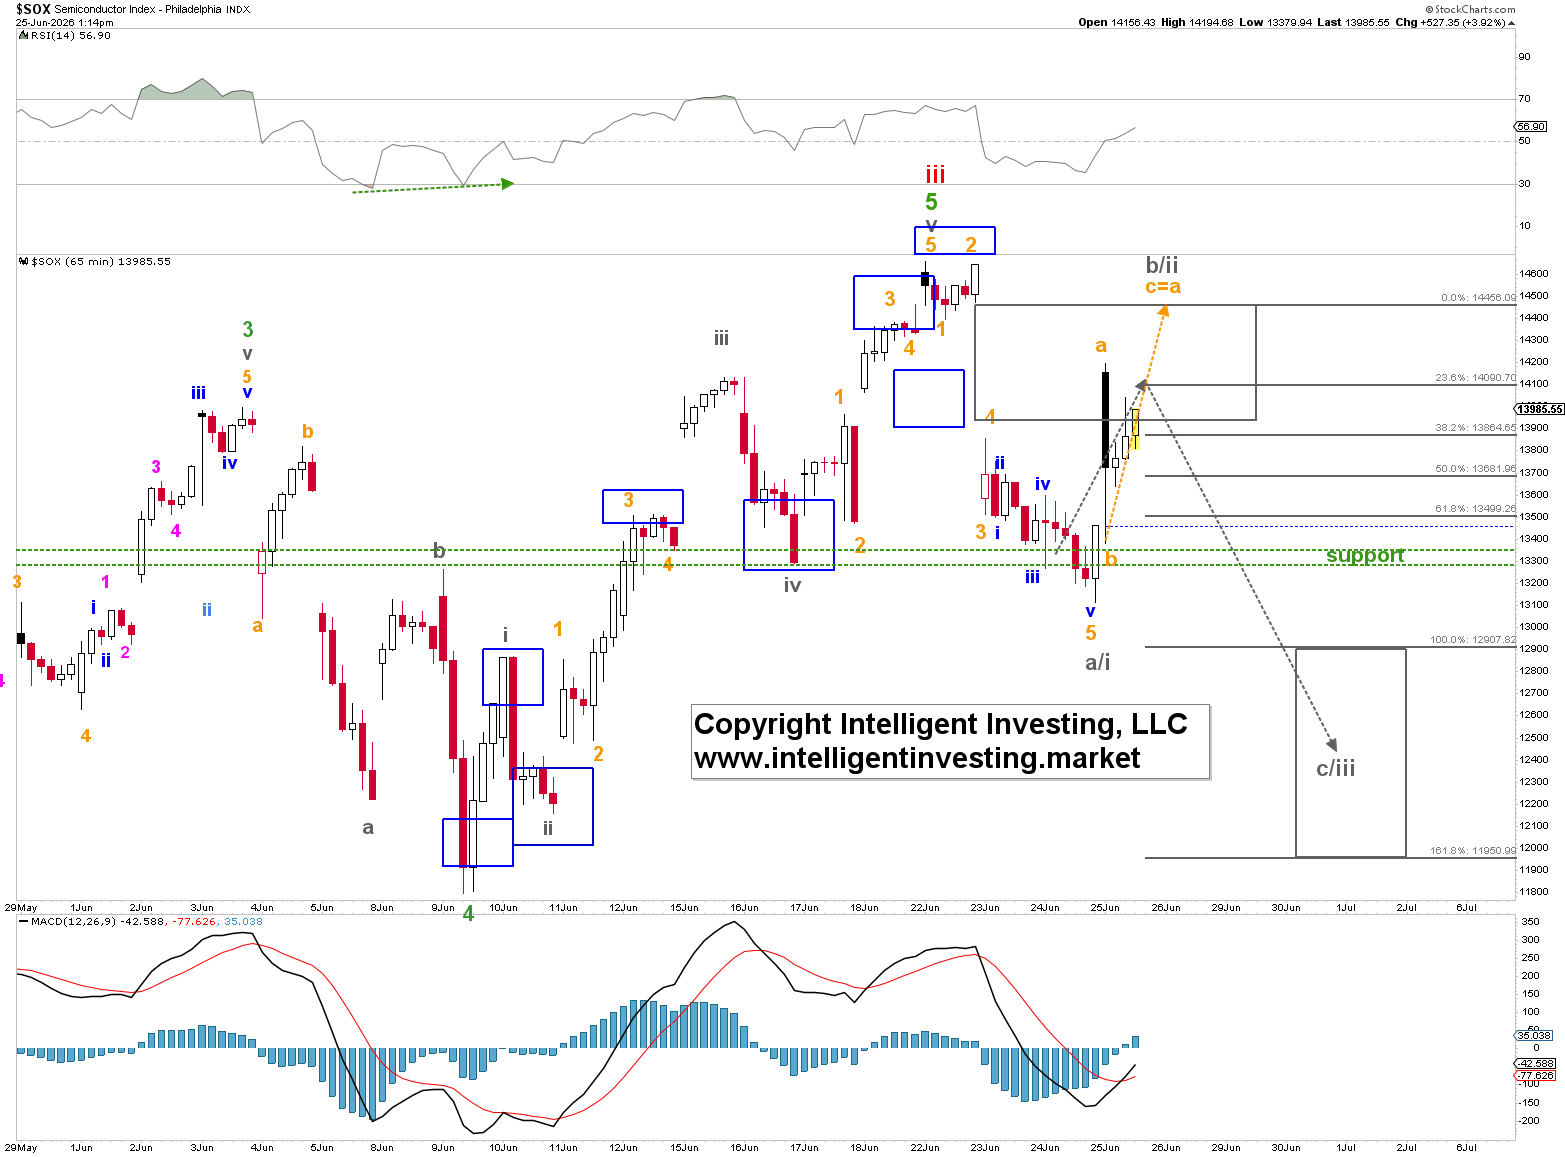
We don’t yet know exactly how this bounce will unfold, so a drop below today’s low without reaching that upper level would mean the gray W-b/ii ended prematurely. Note that all the blue boxes are target zones we previously forecast for our premium members in our daily newsletters, and 6 out of 8 were reached, underscoring the reliability of the EWP in anticipating and projecting market moves, i.e., market moves in predictable patterns. Thus, we expect the gray target zone for W-c/iii to be reached as well, since the gray W-b/ii target zone has now been reached.

Author

Dr. Arnout Ter Schure

Dr. Arnout Ter Schure

Intelligent Investing, LLC

After having worked for over ten years within the field of energy and the environment, Dr.

More from Dr. Arnout Ter Schure
Share:

Editor's Picks

AUD/USD keeps the red near 0.6950 after weak Aussie jobs data

AUD/USD holds losses near 0.6950 on disappointing Australian jobs data, extending the previous day's retracement slide from the monthly high and hitting a fresh weekly low during Thursday’s Asian session. Meanwhile, declining US bond yields drag the US Dollar away from the April 2025 high, touched after Wednesday's hot US CPI, helping limit losses for the currency pair.

USD/JPY slides back below 158.00 as USD reverses post-CPI gains

USD/JPY extends the previous day's pullback from a three-week high, attracting follow-through selling and sliding below 158.00 during Thursday's Asian session. Traders remain on high alert amid speculation that authorities will step in to prop up the Japanese Yen. The US Dollar, meanwhile, reverses Wednesday's hot CPI-led gains to April 2025 highs as US bond yields retreat on China bond-buying talk, further pressuring the pair.

Gold sticks to gains below $4,150 on weak USD; bulls seem hesitant amid Fed hike bets

Gold clings to modest intraday gains through the early European session amid a broadly weaker US Dollar, snapping a three-day losing streak to a one-week low set on Wednesday. The initial aggressive market reaction to hot US consumer inflation figures faded quickly amid expectations that the Fed may not rush to raise interest rates immediately. This led to a further decline in US bond yields, prompting some follow-through USD profit-taking and supporting the non-yielding bullion.

Bitcoin, XRP analyst sentiment jumps as Solana bulls hit 91%: CryptoQuant

Analyst sentiment on Bitcoin, Ethereum, Solana, BNB and XRP has flipped bullish since July, as the top five cryptocurrencies recovered faster and more strongly than during the 2022-2023 market phase, according to CryptoQuant.

US Sept Retail Sales and PPI in focus along with corporate earnings
Asia market update: Bond traders ignore US CPI and focus on equity weakness and AI-credit concerns ahead of TSMC earnings; Kospi circuit breaker triggered for the first time since Jul; CHF and JPY rise on safe-haven demand; US Sept Retail Sales & PPI in focus along with corporate earnings. - Chinese shipping firms collapse amid capacity concerns.
Has Bitcoin really escaped the macro forces it was built to fight?
Over 17 years ago, Satoshi Nakamoto designed Bitcoin (BTC) on the back of a global financial crisis as an alternative to the global monetary system outside the control of central banks, governments and traditional intermediaries. This raises a key question: has Bitcoin really become independent of the macroeconomic forces it was built to challenge?