|

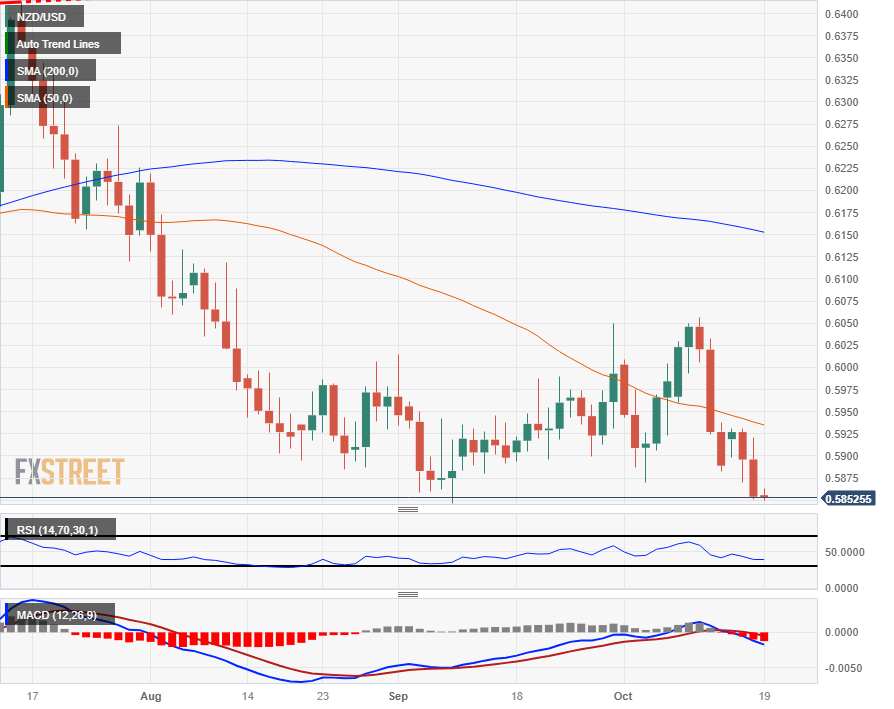
NZD/USD shedding chart space, testing 2023 lows for the year near 0.5850

  • The NZD/USD is trading into the floor, inches away from setting a new low for 2023 below 0.5846.
  • Market sentiment has receded as investors see jitters over geopolitical tensions.
  • Markets looking ahead to Fed Powell appearance later on Thursday, followed by NZ Trade Balance figures.

The NZD/USD slipped even further on Wednesday, declining into 2023's lows and set for a new yearly low below 0.5846.

Broad-market sentiment turned firmly risk-off on the trading day, and the Kiwi heads into the Thursday market session pinned to the floorboards.

The Gaza Strip conflict between Israel and Hamas continues to weigh on geopolitical stability concerns for the Middle East, with market tensions rising after a hospital explosion left over 500 civilians dead. Both Israel and Hamas have pointed fingers at the other, with Hamas claiming an Israeli targeted air strike demolished the building while Israel is blaming an errant Hamas missile.

The US Congress remains frozen in place, unable to elect a new Speaker of the House after Congressional Republicans ejected their own Speaker from the position. Congress has faced down to unsuccessful votes in two days trying to find a replacement, log-jamming government procedure and rattling investors with the US set to run into another funding standoff in four weeks.

Thursday brings US Initial Jobless Claims for the week into October 13th, and markets are expecting to see a small uptick in the number of new unemployment applicants, from 209K to 212K.

Later in the day Federal Reserve (Fed) Chair Jerome Powell will be delivering talking points at a luncheon hosted by the Economic Club of New York, and late Thursday will see New Zealand Trade Balance figures as NZ heads into the Friday early market session.

Kiwi investors will be hoping for an improvement in the headline Trade Balance for the annualized period into September, which last showed a $-15.54B undershoot in August.\

NZD/USD Technical Outlook

The Kiwi remains woefully underbid, testing into 2023's lows and set for a break of the year's bottom bids, and Kiwi price action continues to follow a declining 50-day Simple Moving Average (SMA) further down the charts.

A bearish continuation into fresh lows for the year will see the way open up for an extended decline into 2022's lows far below at 0.5511, while a bullish recovery will still face long-term technical resistance from the 200-day SMA currently rolling over into bearish acceleration from 0.6152.

NZD/USD Daily Chart
NZD/USD Technical Levels

NZD/USD

Overview
Today last price0.5851
Today Daily Change-0.0045
Today Daily Change %-0.76
Today daily open0.5896
 
Trends
Daily SMA200.5953
Daily SMA500.5942
Daily SMA1000.6054
Daily SMA2000.6157
 
Levels
Previous Daily High0.5931
Previous Daily Low0.587
Previous Weekly High0.6056
Previous Weekly Low0.5882
Previous Monthly High0.605
Previous Monthly Low0.5847
Daily Fibonacci 38.2%0.5893
Daily Fibonacci 61.8%0.5908
Daily Pivot Point S10.5867
Daily Pivot Point S20.5838
Daily Pivot Point S30.5806
Daily Pivot Point R10.5928
Daily Pivot Point R20.596
Daily Pivot Point R30.5989

Author

Joshua Gibson

Joshua joins the FXStreet team as an Economics and Finance double major from Vancouver Island University with twelve years' experience as an independent trader focusing on technical analysis.


More from Joshua Gibson
Share:

Editor's Picks

AUD/USD keeps the red near 0.6950 after weak Aussie jobs data

AUD/USD holds losses near 0.6950 on disappointing Australian jobs data, extending the previous day's retracement slide from the monthly high and hitting a fresh weekly low during Thursday’s Asian session. Meanwhile, declining US bond yields drag the US Dollar away from the April 2025 high, touched after Wednesday's hot US CPI, helping limit losses for the currency pair.

USD/JPY slides back below 158.00 as USD reverses post-CPI gains

USD/JPY extends the previous day's pullback from a three-week high, attracting follow-through selling and sliding below 158.00 during Thursday's Asian session. Traders remain on high alert amid speculation that authorities will step in to prop up the Japanese Yen. The US Dollar, meanwhile, reverses Wednesday's hot CPI-led gains to April 2025 highs as US bond yields retreat on China bond-buying talk, further pressuring the pair.

Gold rebounds to $4,150 as China bond-buying reports smash US yields

Gold attracts strong buying and retests $4,150 during the Asian session on Thursday, snapping a three-day losing streak to a one-week low. Retreating US bond yields drag the US Dollar away from the April 2025 high, touched in reaction to Wednesday’s hot US CPI report, and boost the non-yielding bullion. Reports that China is quietly buying US Treasuries through Canada are smashing US Treasury bond yields and the USD.

Bitcoin falls on hot CPI: Why $80,000 support matters

Bitcoin's (BTC) most critical level to watch is near $80,000 as September's hot inflation reading pressures the crypto market, according to Glassnode. The top crypto declined within minutes of the September Consumer Price Index (CPI) release, which showed a 3.7% annual increase in headline inflation, above forecasts of 3.6%. Core inflation, which excludes food and energy prices, came in at 2.6%.

China seems routing US Treasury holdings through Canada

According to a Bloomberg report, China seems to be moving United States securities to non-US custodian banks in other countries, masking its role in financing US deficits.

Has Bitcoin really escaped the macro forces it was built to fight?
Over 17 years ago, Satoshi Nakamoto designed Bitcoin (BTC) on the back of a global financial crisis as an alternative to the global monetary system outside the control of central banks, governments and traditional intermediaries. This raises a key question: has Bitcoin really become independent of the macroeconomic forces it was built to challenge?