NZD/USD Price Forecast: Rises above 0.5750 toward nine-day EMA
- NZD/USD could find initial support at the four-month low of 0.5698.
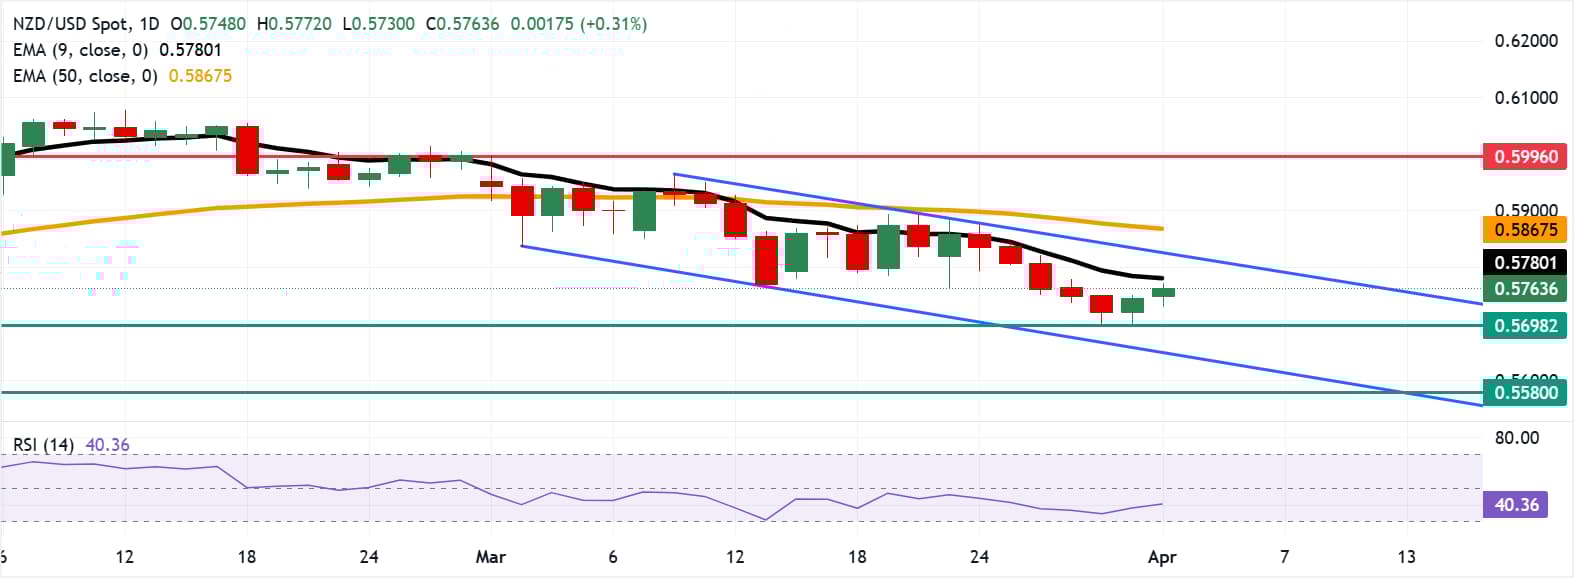
- The 14-day Relative Strength Index (RSI) remains near the 40 level, indicating continued bearish momentum.
- Primary resistance stands at the nine-day EMA of 0.5780.

NZD/USD extends its gains for the second successive day, trading around 0.5760 during the European hours on Wednesday. The technical analysis of the daily chart signals an ongoing bearish bias as the pair remains within a descending channel pattern.
The NZD/USD pair maintains a bearish near-term bias as spot holds below both the nine-day and 50-day Exponential Moving Averages (EMAs), which cap recovery attempts around the mid-0.58s to low-0.59s.
The 14-day Relative Strength Index (RSI) hovers near 40, confirming persistent downside momentum rather than oversold exhaustion and aligning with the recent sequence of lower highs and lower closes.
The NZD/USD pair could find initial support at the four-month low of 0.5698, recorded on March 31, with additional downside support located near the lower boundary of the descending channel around 0.5650. A sustained move below this level may expose the pair to further losses toward the region of the 11-month low near 0.5580, which was last seen in November 2025.
On the upside, immediate resistance is seen at the nine-day EMA near 0.5780. This is followed by the upper boundary of the descending channel around 0.5830, along with the medium-term moving average at 0.5867. A decisive break above this confluence resistance zone would shift the bias toward the upside and potentially open the door for a move toward the monthly high of 0.5996, recorded on March 2.
(The technical analysis of this story was written with the help of an AI tool.)
New Zealand Dollar Price Today
The table below shows the percentage change of New Zealand Dollar (NZD) against listed major currencies today. New Zealand Dollar was the strongest against the US Dollar.
| USD | EUR | GBP | JPY | CAD | AUD | NZD | CHF | |
|---|---|---|---|---|---|---|---|---|
| USD | -0.33% | -0.39% | -0.19% | -0.09% | -0.60% | -0.33% | -0.73% | |
| EUR | 0.33% | -0.07% | 0.13% | 0.24% | -0.30% | 0.00% | -0.43% | |
| GBP | 0.39% | 0.07% | 0.21% | 0.31% | -0.21% | 0.09% | -0.35% | |
| JPY | 0.19% | -0.13% | -0.21% | 0.12% | -0.37% | -0.13% | -0.52% | |
| CAD | 0.09% | -0.24% | -0.31% | -0.12% | -0.49% | -0.23% | -0.66% | |
| AUD | 0.60% | 0.30% | 0.21% | 0.37% | 0.49% | 0.28% | -0.15% | |
| NZD | 0.33% | -0.00% | -0.09% | 0.13% | 0.23% | -0.28% | -0.43% | |
| CHF | 0.73% | 0.43% | 0.35% | 0.52% | 0.66% | 0.15% | 0.43% |
The heat map shows percentage changes of major currencies against each other. The base currency is picked from the left column, while the quote currency is picked from the top row. For example, if you pick the New Zealand Dollar from the left column and move along the horizontal line to the US Dollar, the percentage change displayed in the box will represent NZD (base)/USD (quote).
Author

Akhtar Faruqui
FXStreet
Akhtar Faruqui is a Forex Analyst based in New Delhi, India. With a keen eye for market trends and a passion for dissecting complex financial dynamics, he is dedicated to delivering accurate and insightful Forex news and analysis.


