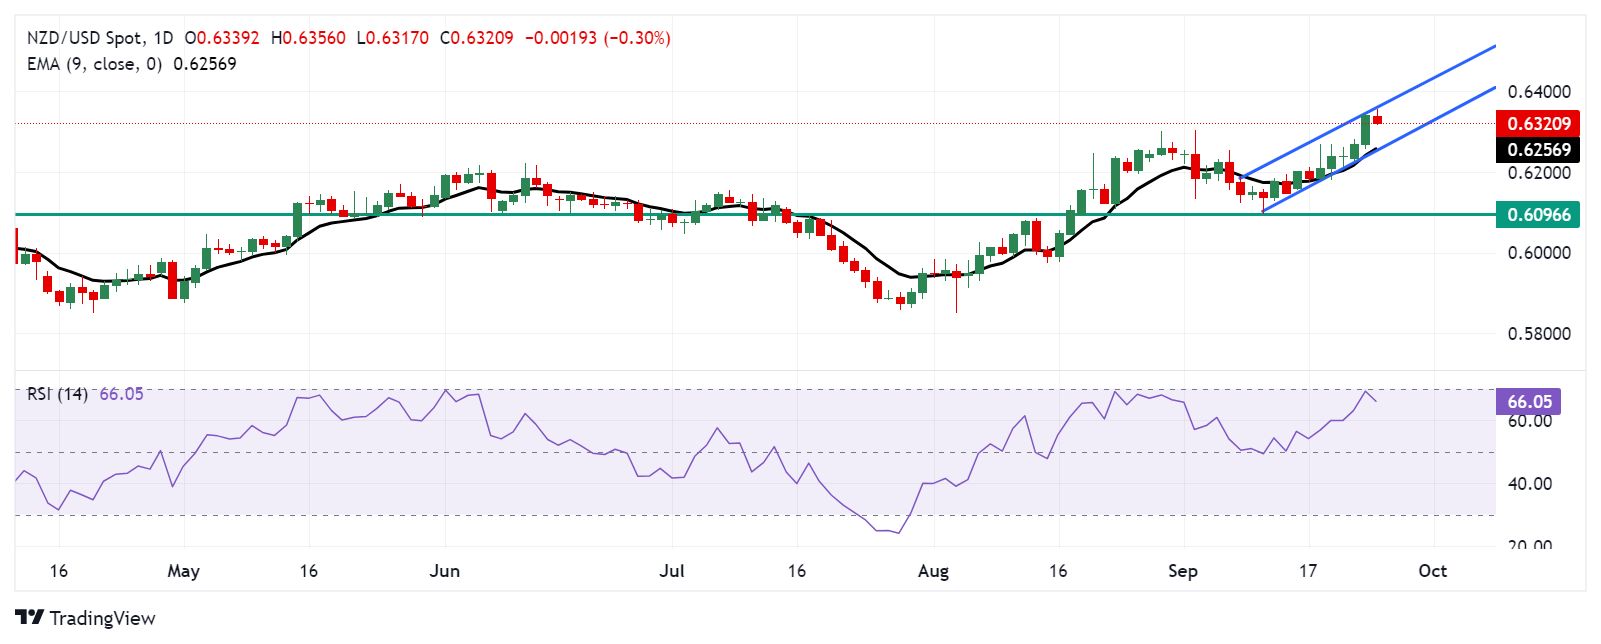
NZD/USD Price Forecast: Remains below 0.6350, the upper boundary of the ascending channel
- NZD/USD may regain ground as it is moving upward within an ascending channel pattern, indicating a bullish bias.
- The 14-day RSI is slightly below the 70 level, indicating a possible upward momentum, with a potential for consolidation.
- The upper boundary of the ascending channel at 0.6360 appears as the immediate resistance.

NZD/USD breaks its five-day winning streak, trading around 0.6330 during the European session on Wednesday. On the daily chart, the pair is moving upward within an ascending channel pattern, indicating a bullish bias.
Additionally, the 14-day Relative Strength Index (RSI) remains above the 50 level, confirming the ongoing bullish trend is intact. Although, the RSI is positioned slightly below the 70 mark, suggesting upward gains remain probable but could face a consolidation soon.
On the upside, the NZD/USD pair is testing the upper boundary of the ascending channel at the 0.6360 level. A breakthrough above the upper boundary could strengthen bullish bias and support the pair to explore the region around the psychological level of 0.6300.
In terms of support, the NZD/USD pair may test the nine-day Exponential Moving Average (EMA) at the 0.6257 level, which is aligned with the lower boundary of the ascending channel. A break below the channel could weaken the bullish sentiment and put pressure on the pair to navigate the area around its five-week low of 0.6106 level.
NZD/USD: Daily Chart
New Zealand Dollar PRICE Today
The table below shows the percentage change of New Zealand Dollar (NZD) against listed major currencies today. New Zealand Dollar was the weakest against the Euro.
| USD | EUR | GBP | JPY | CAD | AUD | NZD | CHF | |
|---|---|---|---|---|---|---|---|---|
| USD | -0.08% | 0.22% | 0.50% | -0.01% | 0.17% | 0.32% | 0.26% | |
| EUR | 0.08% | 0.32% | 0.61% | 0.08% | 0.25% | 0.42% | 0.34% | |
| GBP | -0.22% | -0.32% | 0.27% | -0.24% | -0.07% | 0.06% | 0.03% | |
| JPY | -0.50% | -0.61% | -0.27% | -0.53% | -0.35% | -0.20% | -0.25% | |
| CAD | 0.01% | -0.08% | 0.24% | 0.53% | 0.18% | 0.34% | 0.28% | |
| AUD | -0.17% | -0.25% | 0.07% | 0.35% | -0.18% | 0.17% | 0.10% | |
| NZD | -0.32% | -0.42% | -0.06% | 0.20% | -0.34% | -0.17% | -0.07% | |
| CHF | -0.26% | -0.34% | -0.03% | 0.25% | -0.28% | -0.10% | 0.07% |
The heat map shows percentage changes of major currencies against each other. The base currency is picked from the left column, while the quote currency is picked from the top row. For example, if you pick the New Zealand Dollar from the left column and move along the horizontal line to the US Dollar, the percentage change displayed in the box will represent NZD (base)/USD (quote).
Author

Akhtar Faruqui
FXStreet
Akhtar Faruqui is a Forex Analyst based in New Delhi, India. With a keen eye for market trends and a passion for dissecting complex financial dynamics, he is dedicated to delivering accurate and insightful Forex news and analysis.


