NZD/USD Price Forecast: Remains below 0.5900, nine-day EMA due to growing bearish bias
- NZD/USD depreciates toward throwback support at 0.5850 level within the descending channel pattern.
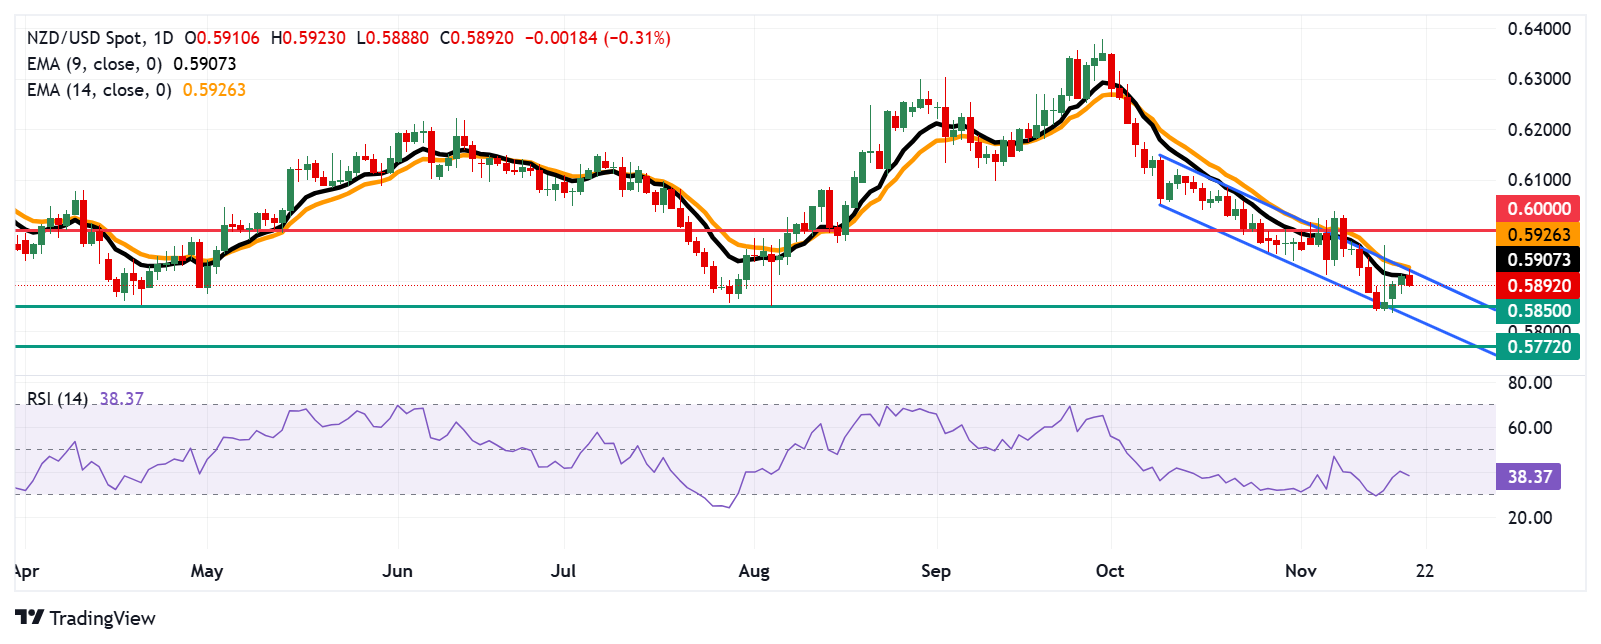
- The daily chart analysis indicates an increasing bearish bias, with the pair moving downwards within the descending channel pattern.
- Immediate resistance is found at the nine-day EMA of 0.5907, with the next level at the 14-day EMA of 0.5926.

The NZD/USD pair breaks its three-day winning streak, trading around 0.5890 during the European session on Wednesday. A review of the daily chart highlights a growing bearish bias, as the pair moves downwards within the descending channel pattern.
The nine-day Exponential Moving Average (EMA) remains below the 14-day EMA, signaling persistent weakness in short-term price momentum. Meanwhile, the 14-day Relative Strength Index (RSI) consolidates below 50 level, confirming the ongoing bearish sentiment.
Regarding the support, the NZD/USD pair could navigate the region around the “throwback support” at the psychological level of 0.5850, followed by the lower boundary of the descending channel at 0.5930 level.
A decisive break below this channel would reinforce the bearish outlook, increasing downward pressure and potentially driving the Kiwi pair toward its two-year low of 0.5772, last seen in November 2023.
On the upside, immediate resistance lies at the nine-day EMA at 0.5907, followed by the 14-day EMA at 0.5926, which coincides with the upper boundary of the descending channel. A breakout above this channel would weaken the bearish momentum, paving the way for the NZD/USD pair to target the psychological level of 0.6000.
NZD/USD: Daily Chart
New Zealand Dollar PRICE Today
The table below shows the percentage change of New Zealand Dollar (NZD) against listed major currencies today. New Zealand Dollar was the weakest against the British Pound.
| USD | EUR | GBP | JPY | CAD | AUD | NZD | CHF | |
|---|---|---|---|---|---|---|---|---|
| USD | 0.23% | -0.06% | 0.62% | 0.01% | 0.19% | 0.34% | 0.20% | |
| EUR | -0.23% | -0.28% | 0.41% | -0.22% | -0.04% | 0.10% | -0.04% | |
| GBP | 0.06% | 0.28% | 0.67% | 0.07% | 0.24% | 0.39% | 0.25% | |
| JPY | -0.62% | -0.41% | -0.67% | -0.59% | -0.42% | -0.29% | -0.42% | |
| CAD | -0.01% | 0.22% | -0.07% | 0.59% | 0.17% | 0.32% | 0.18% | |
| AUD | -0.19% | 0.04% | -0.24% | 0.42% | -0.17% | 0.14% | 0.00% | |
| NZD | -0.34% | -0.10% | -0.39% | 0.29% | -0.32% | -0.14% | -0.14% | |
| CHF | -0.20% | 0.04% | -0.25% | 0.42% | -0.18% | -0.01% | 0.14% |
The heat map shows percentage changes of major currencies against each other. The base currency is picked from the left column, while the quote currency is picked from the top row. For example, if you pick the New Zealand Dollar from the left column and move along the horizontal line to the US Dollar, the percentage change displayed in the box will represent NZD (base)/USD (quote).
Author

Akhtar Faruqui
FXStreet
Akhtar Faruqui is a Forex Analyst based in New Delhi, India. With a keen eye for market trends and a passion for dissecting complex financial dynamics, he is dedicated to delivering accurate and insightful Forex news and analysis.


