NZD/USD Price Forecast: Languishes near 0.5720 as geopolitical risks weigh
- NZD/USD remains on its back foot in the lower range of the 0.5700s.
- Contrasting news from the US-Iran peace talks is keeping risk appetite subdued.
- The pair is on a bearish trend with YTD lows at the 0.5680 area on sight.

The New Zealand Dollar (NZD) ticks down against the US Dollar (USD) on Monday, trading at 0.5730 at the time of writing, holding losses from last week’s sell-off and drawing closer to the year-to-date low of 0.5681. Contrasting news from the Middle East conflict is keeping investors on edge at the start of the week and is weighing on risk appetite.
The first round of negotiations between the US and Iran ended with some progress, according to a joint statement by the mediators from Qatar and Pakistan. Both parties would have agreed to end the conflict “on all fronts” within 60 days and establish a line of communication to ensure safe passage through the Strait of Hormuz.
The key waterway, however, was closed by Tehran over the weekend, and US President Donald Trump threatened to “rake over” the country, which, according to Iranian media, prompted Iranian negotiators to walk out of the negotiating room at some point.
Technical Analysis: Bears eye the YTD low, at 0.5681
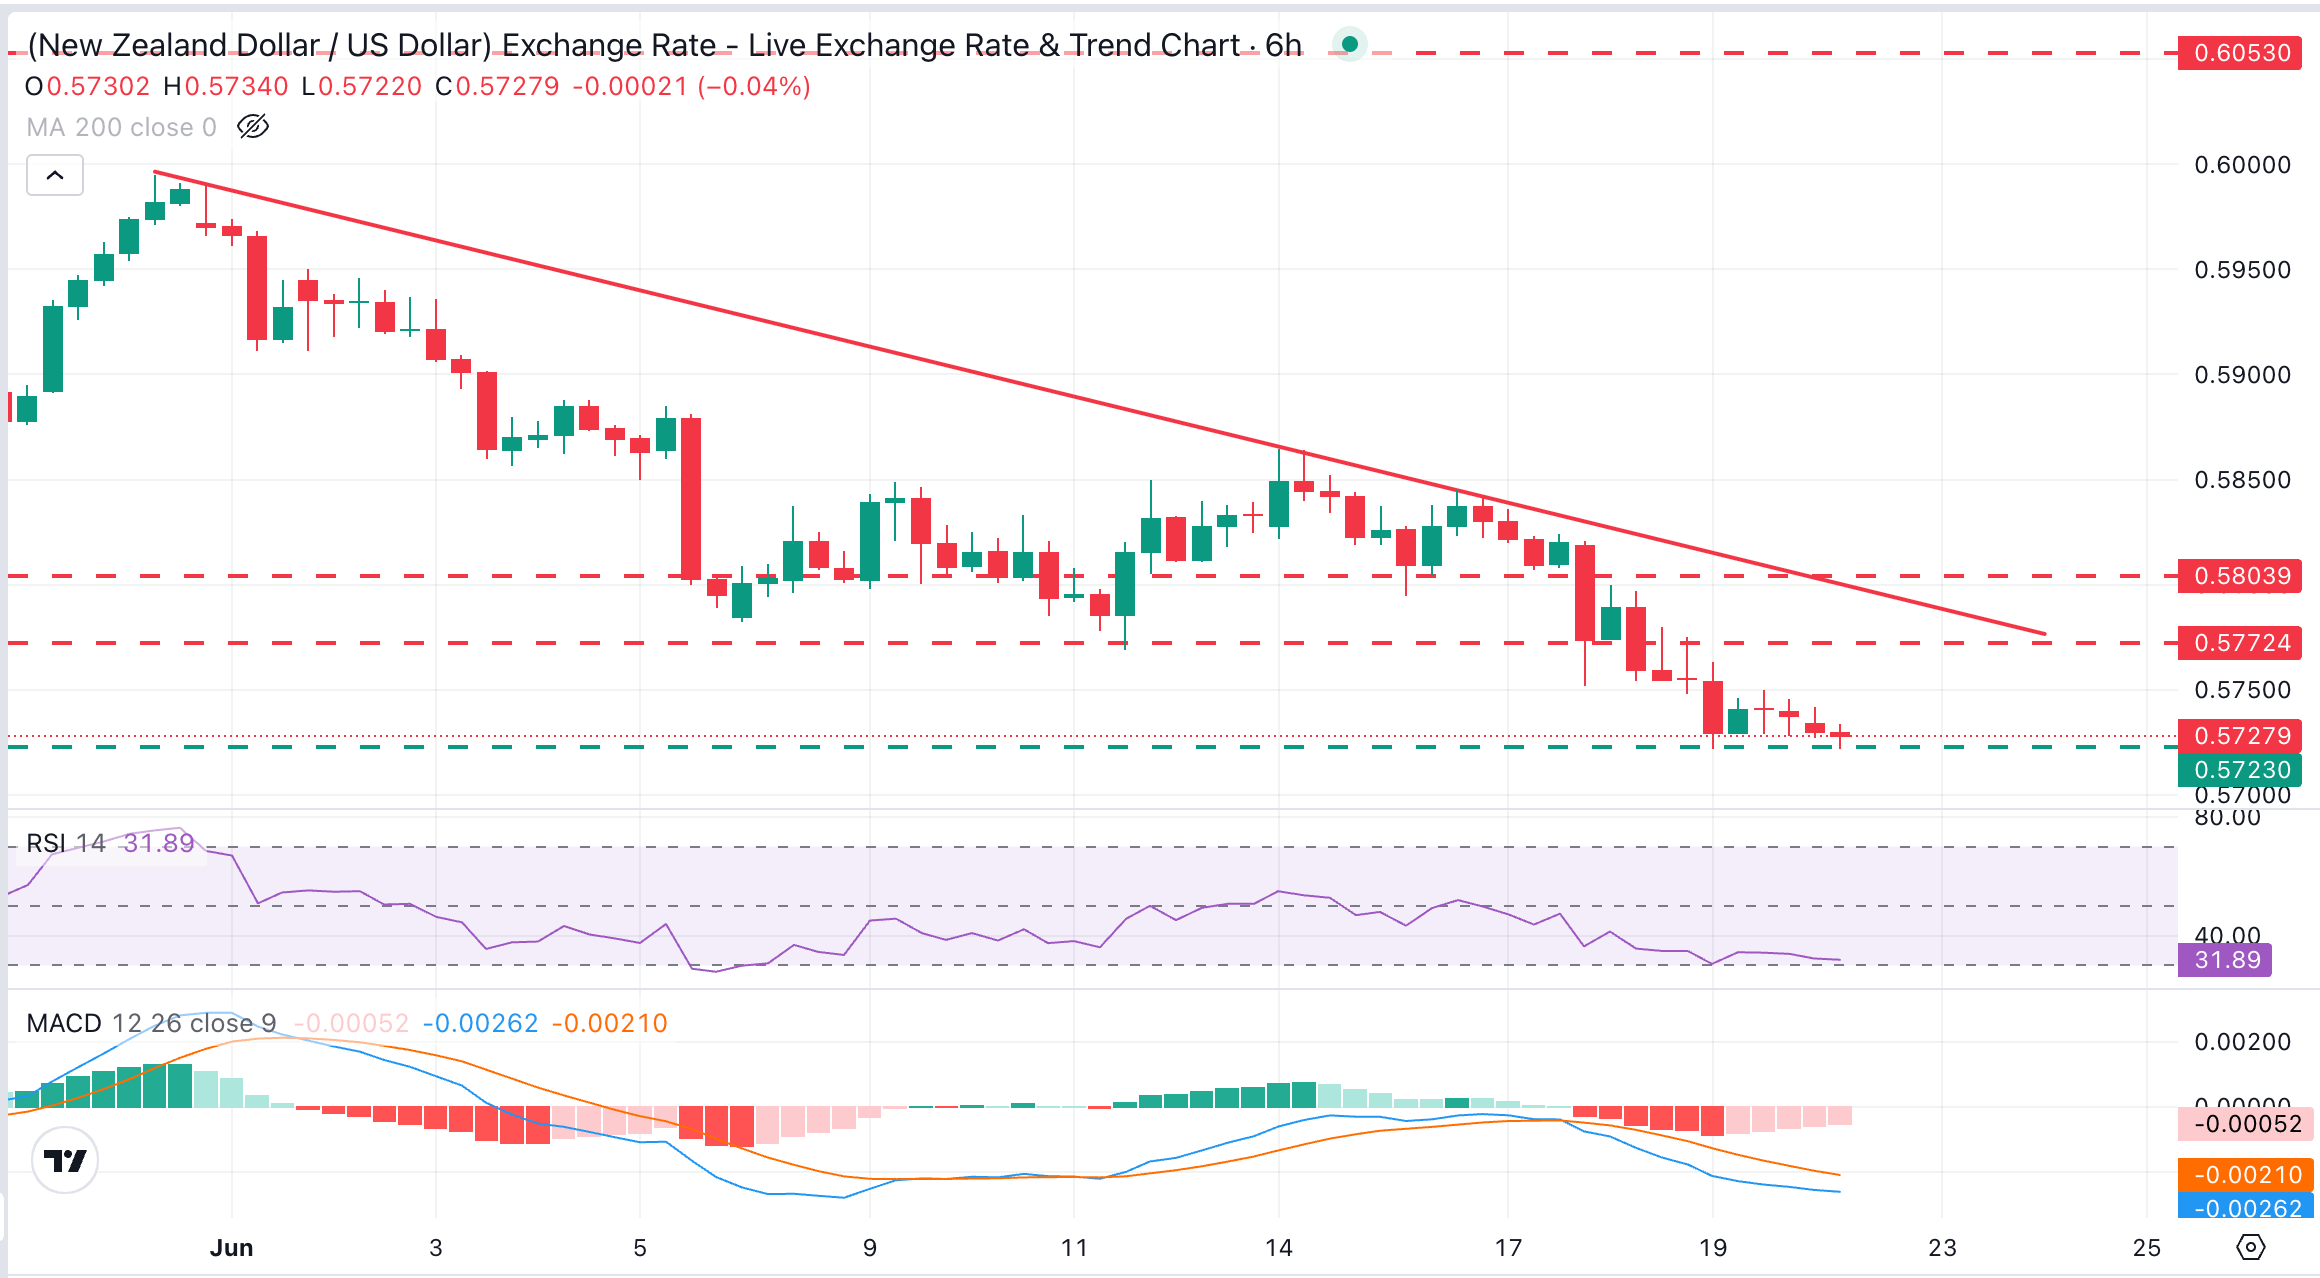
NZD/USD trades at 0.5729, maintaining a bearish near-term tone as it drifts closer to the year-to-date low of 0.5680. Momentum indicators in 4-hour charts reinforce the downside bias, with the Relative Strength Index (14) hovering near 33 and the Moving Average Convergence Divergence (MACD) line marginally below zero.
Bears are being contained above session highs at 0.5720, which keeps price action relatively close to the early April lows at 0.5681. Further down, the next target would be the November 2025 low, in the 09.5580 area.
Upside attempts remain muted on Monday, with bulls likely to be challenged at Friday's top of 0.5770, ahead of the confluence of the descending trendline from late May highs and the June 18 high, in the 0.5800 area.
(The technical analysis of this story was written with the help of an AI tool.)
New Zealand Dollar Price Today
The table below shows the percentage change of New Zealand Dollar (NZD) against listed major currencies today. New Zealand Dollar was the strongest against the Canadian Dollar.
| USD | EUR | GBP | JPY | CAD | AUD | NZD | CHF | |
|---|---|---|---|---|---|---|---|---|
| USD | 0.13% | 0.22% | 0.23% | 0.27% | 0.14% | 0.17% | 0.09% | |
| EUR | -0.13% | 0.08% | 0.09% | 0.12% | 0.05% | 0.06% | -0.04% | |
| GBP | -0.22% | -0.08% | 0.02% | 0.07% | -0.05% | -0.03% | -0.11% | |
| JPY | -0.23% | -0.09% | -0.02% | 0.05% | -0.07% | -0.06% | -0.11% | |
| CAD | -0.27% | -0.12% | -0.07% | -0.05% | -0.13% | -0.12% | -0.16% | |
| AUD | -0.14% | -0.05% | 0.05% | 0.07% | 0.13% | 0.04% | -0.04% | |
| NZD | -0.17% | -0.06% | 0.03% | 0.06% | 0.12% | -0.04% | -0.07% | |
| CHF | -0.09% | 0.04% | 0.11% | 0.11% | 0.16% | 0.04% | 0.07% |
The heat map shows percentage changes of major currencies against each other. The base currency is picked from the left column, while the quote currency is picked from the top row. For example, if you pick the New Zealand Dollar from the left column and move along the horizontal line to the US Dollar, the percentage change displayed in the box will represent NZD (base)/USD (quote).
Author

Guillermo Alcala
FXStreet
Graduated in Communication Sciences at the Universidad del Pais Vasco and Universiteit van Amsterdam, Guillermo has been working as financial news editor and copywriter in diverse Forex-related firms, like FXStreet and Kantox.
















