|

NZD/USD Price Analysis: Bulls attempt to retake the 20-day SMA, outlook promising

  • The NZD/USD pair has been choppy between 0.6159-0.6260 in the past sessions.
  • The RSI shows rising buying pressure, whereas the MACD suggests a potential reversal in the bearish momentum.

On Thursday, the NZD/USD pair rose to 0.6239, above the 20-day Simple Moving Average (SMA) which served as a strong resistance in the last sessions. Indicators meanwhile look promising.

The Relative Strength Index (RSI) is at 59, in positive territory with a rising slope, signaling rising buying pressure. Conversely, the Moving Average Convergence Divergence (MACD) histogram is red and falling, suggesting that selling pressure may be declining. This presents a mixed outlook for the pair.

NZD/USD daily chart

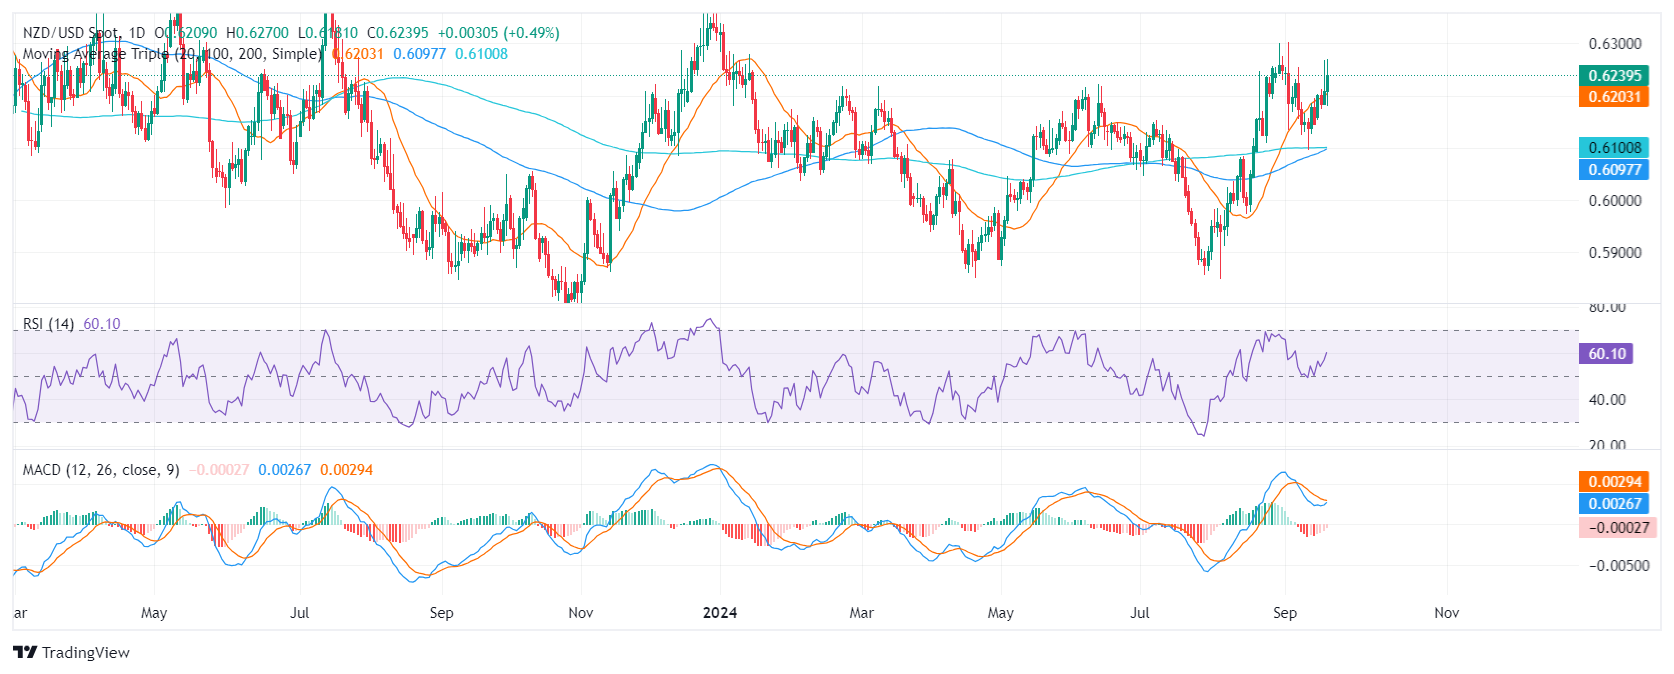
Key support levels include 0.6150, 0.6120, and 0.6100, while resistance levels are 0.6190, 0.6200, and 0.6230. A close above the 20-day SMA, currently at 0.6200, could signal further upward movement with the next target being at early September highs near 0.6300.

Author

Patricio Martín

Patricio is an economist from Argentina passionate about global finance and understanding the daily movements of the markets.

More from Patricio Martín
Share:

Editor's Picks

AUD/USD eyes 0.7150 barrier nine-day EMA

AUD/USD inches higher after registering modest losses in the previous day, trading around 0.7130 during the Asian hours. The technical analysis of the daily chart indicates that the pair is moving sideways within the rectangle pattern, suggesting a consolidation as neither the bulls nor the bears have enough momentum to take control of the market.

USD/JPY trades below 160.00 intervention threshold; bullish bias intact

The USD/JPY pair attracts some sellers during the Asian session amid fears that authorities will step in again to prop up the Japanese Yen. Furthermore, the Israel-Lebanon truce prompts some profit-taking around the US Dollar and exerts downward pressure on the currency pair.

Gold meets contention near $4,420…for now

Gold extends its recovery past the $4,500 mark per troy ounce on Thursday. The yellow metal’s advance comes amid the resurgence of some selling interest around the, improving risk sentiment, and declining US Treasury yields across the curve.

Bitcoin’s massive storm is back: Why the sell-off is far from over

Bitcoin price action over the last few weeks has felt less like a normal, healthy correction and more like a slow grinding crash that continues to wreak havoc on holdings and trading accounts. And everything suggests that the dramatic crash isn’t over.

Nonfarm payrolls: Testing the limits of Fed policy patience

The upcoming nonfarm payrolls report for May will provide the final update on the US labor market before Kevin Warsh attends his first policy meeting as the new Fed Chair later this month.

Recession on paper: What really moves the Canadian Loonie now?

Statistics Canada handed the headline writers a gift and the analysts a headache. Real GDP shrank 0.1% on an annualized basis in the first quarter, and with the fourth quarter of 2025 revised down to a 1.0% contraction, that is two negative quarters in a row, the textbook definition of a technical recession and Canada's first since the pandemic.