Nvidia hits another new high: Key breakout and retracement targets

On 5 October, NVIDIA returned to a record high while the Nasdaq also closed at a fresh peak. The move came even as the US 10-year Treasury yield reached about 5.31%, creating a striking split between expensive money and strong technology stocks.
The simple explanation is not that markets have stopped caring about rates. NVIDIA is producing enough real earnings and cash flow to keep attracting capital, but the rally around it is becoming increasingly dependent on AI leadership, positioning and continued access to enormous pools of funding.
NVIDIA’s fundamentals still justify the lead
NVIDIA’s latest numbers remain exceptional. Fiscal Q2 2027 revenue reached $96.2 billion, up 106% from a year earlier, while Data Center revenue rose 117% to $89.0 billion and GAAP net income reached $59.7 billion.
That is why NVIDIA can sit at an all-time high and still look relatively inexpensive against its own history. Bloomberg data recently put the stock below 17 times expected earnings over the next 12 months, near its cheapest valuation in more than a decade.
The new buyback adds another layer. Just last Monday on September 28th, NVIDIA increased its repurchase authorisation by $150 billion, taking the remaining programme to $235 billion through fiscal 2028, fueling investor optimism.
The fragility sits further down the AI chain
The stronger NVIDIA becomes, the more important the financial health of its customers becomes. Anthropic’s IPO filing showed huge long-term compute commitments alongside heavy operating losses, while OpenAI is projected to burn through roughly $278 billion of cash between 2026 and 2030.
This creates a clear split inside the AI boom: hardware suppliers are turning AI spending into revenue today, while many model developers are still funding growth with outside capital. If funding conditions tighten, the same spending cycle that makes NVIDIA powerful can become a vulnerability.
NVIDIA is still in a bullish trend
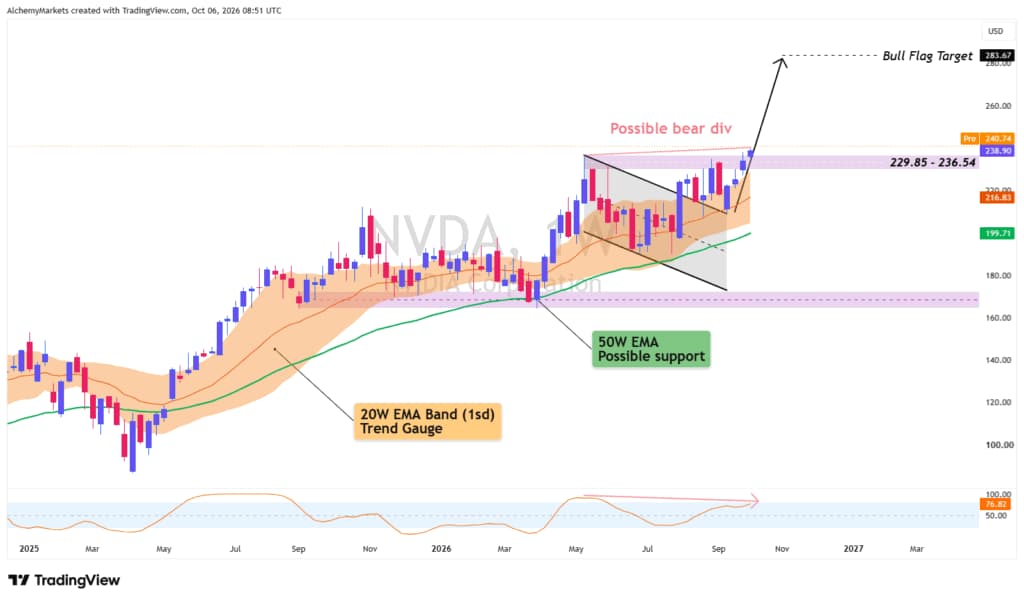
On the weekly NVIDIA chart, price has broken beyond the previous $235.74 all-time high after a long consolidation. The cleaner confirmation is a weekly close above that old high, while the larger bull-flag structure still points to further upside if the breakout holds.
The daily chart is less comfortable. Price is approaching the top of the rising channel near $246.16 and Stochastic RSI is already overbought, while the weekly oscillator is also moving towards overbought territory and may be developing bearish divergence.
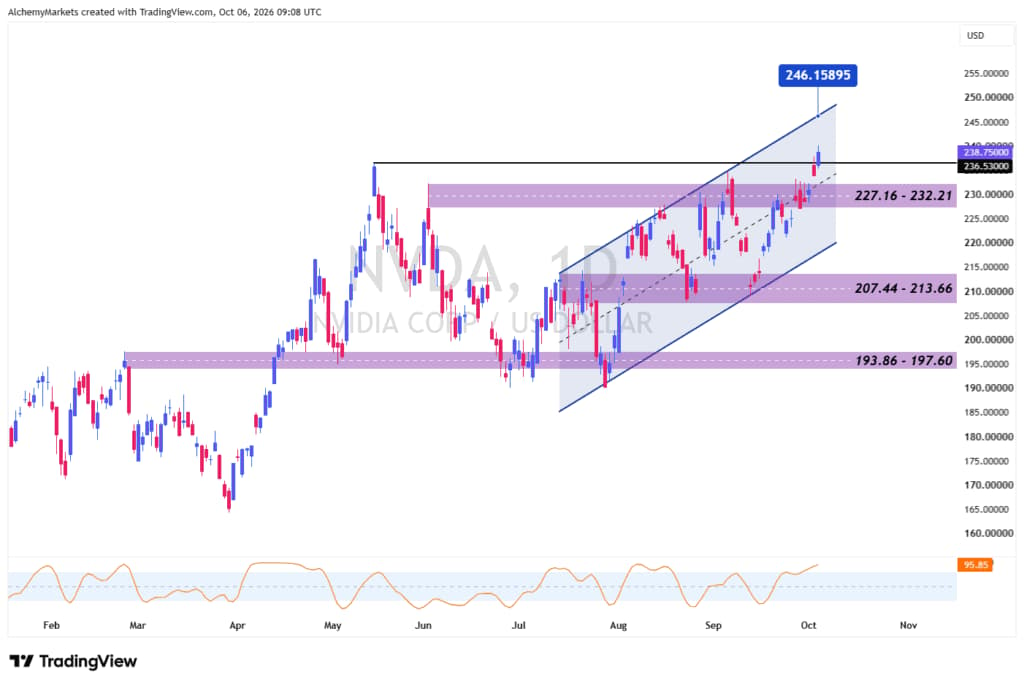
A large rejection wick or a strong bearish candle from the upper channel would be a more meaningful warning than the overbought reading alone. Initial support sits around 227.16–232.21, followed by the 207.44–213.66 area.
Nasdaq Still Has Room If AI Leadership Holds
The Nasdaq chart is why this is not yet a broad bearish call. USTEC remains inside a rising weekly channel, has stayed above the 20-week EMA band for three weeks and its weekly Stochastic RSI is not yet overbought.
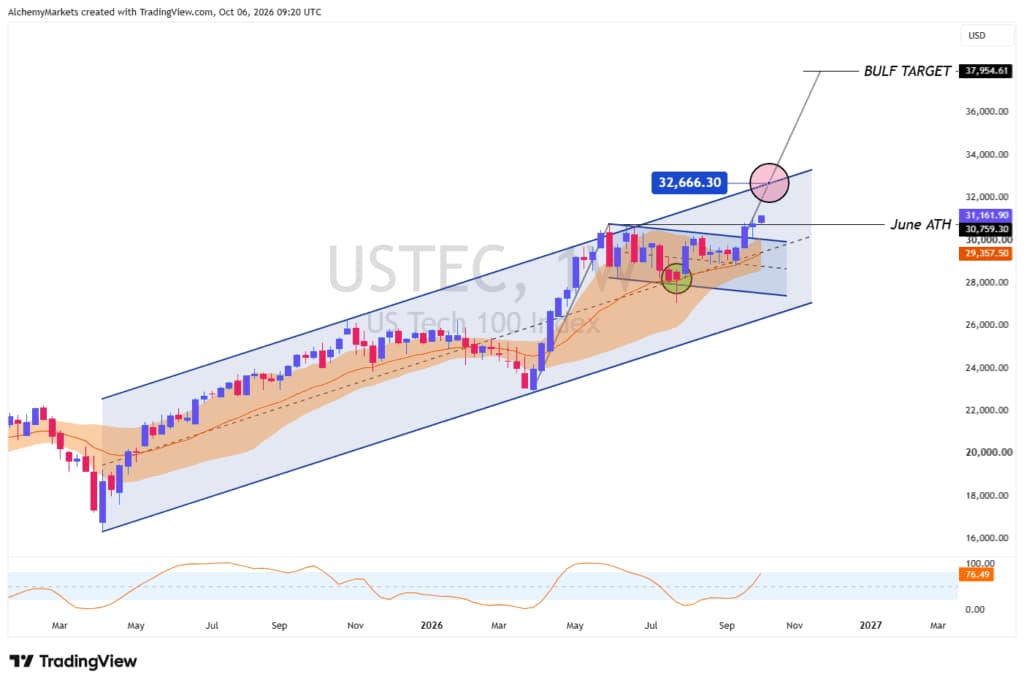
The current bull-flag projection reaches roughly 38,000. However, underlying breadth remains weaker than the headline index: equal-weight equities have lagged, fewer stocks have participated in the advance, and US consumer confidence fell to 81.9 in September.
The result is a market with strong upside momentum but a narrower safety net. If NVIDIA pauses and broader participation improves, the rally becomes healthier; if NVIDIA rolls over while breadth stays weak, the index loses its most important engine.
What matters next
The base case remains constructive, but no longer comfortable. A sustained NVIDIA weekly close above $235.74, followed by a clean break of the daily channel near $246.16, would strengthen the bull case; a rejection at the upper channel combined with weakening Nasdaq breadth would shift the focus towards a deeper retracement.
For now, NVIDIA is proving that the AI boom has real profits at the hardware layer.
However, with both the S&P 500 and Nasdaq heavily concentrated in AI hardware stocks, the broader market remains vulnerable to sharp downturns should demand for AI chips soften.
The safety net from diversification of investing in index funds is no longer here.
Technical focus: NVIDIA remains structurally bullish while above its breakout zone, but a daily rejection near $246.16 would increase the odds of a short-term pullback. Nasdaq remains the broader confirmation chart.
Author

Zorrays Junaid
Alchemy Markets
Zorrays Junaid has extensive combined experience in the financial markets as a portfolio manager and trading coach. More recently, he is an Analyst with Alchemy Markets, and has contributed to DailyFX and Elliott Wave Forecast in the past.

















