New Zealand Dollar grinds lower as the Iran truce frays
- NZD/USD logged a fourth straight daily loss as renewed Iran tensions revived the safe-haven Dollar.
- The much-touted ceasefire framework looked shakier as both Washington and Tehran hardened their rhetoric.
- Daily momentum flashed oversold near a key floor, yet sellers kept the trend pointed firmly down.

The New Zealand Dollar closed lower for a fourth consecutive session on Monday, drifting toward the 0.5700 handle as a firmer US Dollar and souring risk sentiment did the damage. The proximate trigger was geopolitical, with rhetoric from Washington and Tehran sharpening into Tuesday and denting the fragile peace narrative that had calmed markets only days earlier. For a high-beta currency like the Kiwi, the combination of safe-haven Dollar demand and wobbling risk appetite is close to a worst case, a dynamic the chart captures cleanly.
The truce nobody quite believed
Markets had spent the prior week pricing a tidy de-escalation after the Versailles framework was signed, with Crude Oil unwinding much of its conflict premium and risk assets breathing easier. That optimism always sat uneasily against the facts on the ground; the renewed sniping between the two capitals over implementation and sequencing has reminded traders that a signed document is not the same as a settled conflict. Monday's only domestic release, a firmer set of credit card spending figures, barely registered; the Kiwi simply went along for the ride lower.
A hawkish Fed sharpens the knife
Working in the Dollar's favour is a Federal Reserve (Fed) that has turned notably less accommodative. Last week's Federal Open Market Committee (FOMC) decision left rates at 3.75% but came wrapped in an upgraded dot plot, with the median path nudged toward 3.8% for this year and the Personal Consumption Expenditures Price Index (PCE) projection lifted to 3.6%. A central bank signalling higher-for-longer while the rest of the field leans dovish is a structural tailwind for the greenback, one that leaves rate-sensitive currencies like the Kiwi swimming against the current.
Pressing the April floor
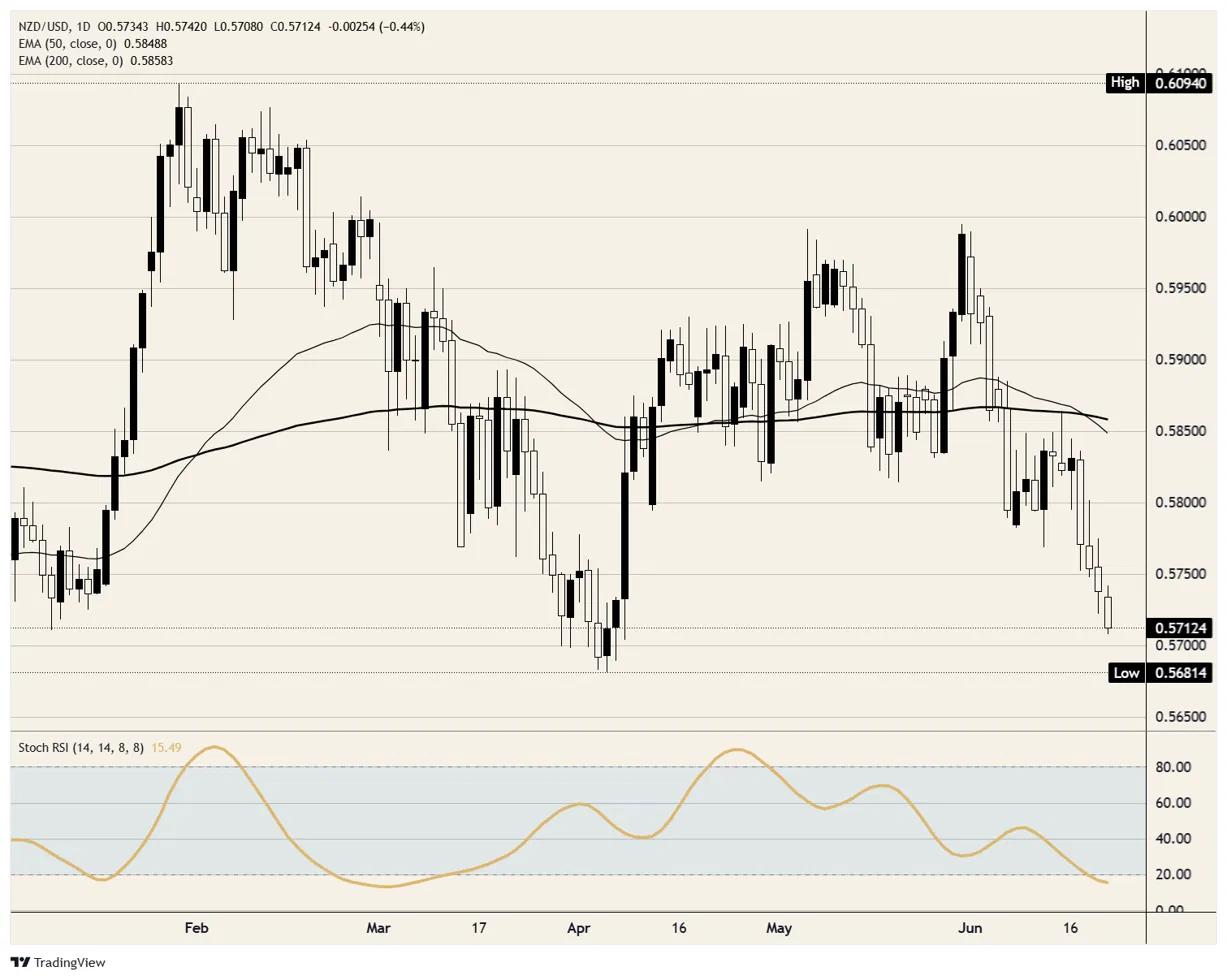
On the daily chart, the Kiwi now trades well beneath both its 50-period and 200-period Exponential Moving Average (EMA), clustered up around 0.5850, a configuration that keeps the broader trend firmly bearish and rallies on a short leash. The four-day slide has dragged price back to the 0.5700 area that arrested April's decline, with Monday's low printing just above the handle before a late bounce clawed back some ground. That bounce arrived with the daily Stochastic Relative Strength Index (Stoch RSI) deeply oversold, near 15, which argues for the risk of a corrective pop, though nothing in the structure yet suggests the sellers are finished.
Resistance: The first cap sits near 0.5750, where recent daily ranges have stalled, with 0.5800 and then the 0.5850 moving-average cluster marking the levels a genuine trend reversal would need to reclaim.
Support: The 0.5700 handle is the line that matters, reinforced by April's rebound from the same zone; a decisive break exposes the mid-April spike low just beneath and then opens room toward 0.5650.
Bias: Lower while price holds below 0.5750. The oversold daily reading and Monday's late bounce flag the risk of a relief rally, but with a hawkish Fed and a fraying truce both pushing the same way, the path of least resistance stays down. Rallies are there to be sold. Tuesday's US Purchasing Managers Index (PMI) prints at 13:45 GMT are the next near-term test.
NZD/USD daily chart
New Zealand Dollar FAQs
The New Zealand Dollar (NZD), also known as the Kiwi, is a well-known traded currency among investors. Its value is broadly determined by the health of the New Zealand economy and the country’s central bank policy. Still, there are some unique particularities that also can make NZD move. The performance of the Chinese economy tends to move the Kiwi because China is New Zealand’s biggest trading partner. Bad news for the Chinese economy likely means less New Zealand exports to the country, hitting the economy and thus its currency. Another factor moving NZD is dairy prices as the dairy industry is New Zealand’s main export. High dairy prices boost export income, contributing positively to the economy and thus to the NZD.
The Reserve Bank of New Zealand (RBNZ) aims to achieve and maintain an inflation rate between 1% and 3% over the medium term, with a focus to keep it near the 2% mid-point. To this end, the bank sets an appropriate level of interest rates. When inflation is too high, the RBNZ will increase interest rates to cool the economy, but the move will also make bond yields higher, increasing investors’ appeal to invest in the country and thus boosting NZD. On the contrary, lower interest rates tend to weaken NZD. The so-called rate differential, or how rates in New Zealand are or are expected to be compared to the ones set by the US Federal Reserve, can also play a key role in moving the NZD/USD pair.
Macroeconomic data releases in New Zealand are key to assess the state of the economy and can impact the New Zealand Dollar’s (NZD) valuation. A strong economy, based on high economic growth, low unemployment and high confidence is good for NZD. High economic growth attracts foreign investment and may encourage the Reserve Bank of New Zealand to increase interest rates, if this economic strength comes together with elevated inflation. Conversely, if economic data is weak, NZD is likely to depreciate.
The New Zealand Dollar (NZD) tends to strengthen during risk-on periods, or when investors perceive that broader market risks are low and are optimistic about growth. This tends to lead to a more favorable outlook for commodities and so-called ‘commodity currencies’ such as the Kiwi. Conversely, NZD tends to weaken at times of market turbulence or economic uncertainty as investors tend to sell higher-risk assets and flee to the more-stable safe havens.
Author

Joshua Gibson
FXStreet
Joshua joins the FXStreet team as an Economics and Finance double major from Vancouver Island University with twelve years' experience as an independent trader focusing on technical analysis.


