|

Nasdaq Futures target new record high after ending double three Elliott Wave structure [Video]

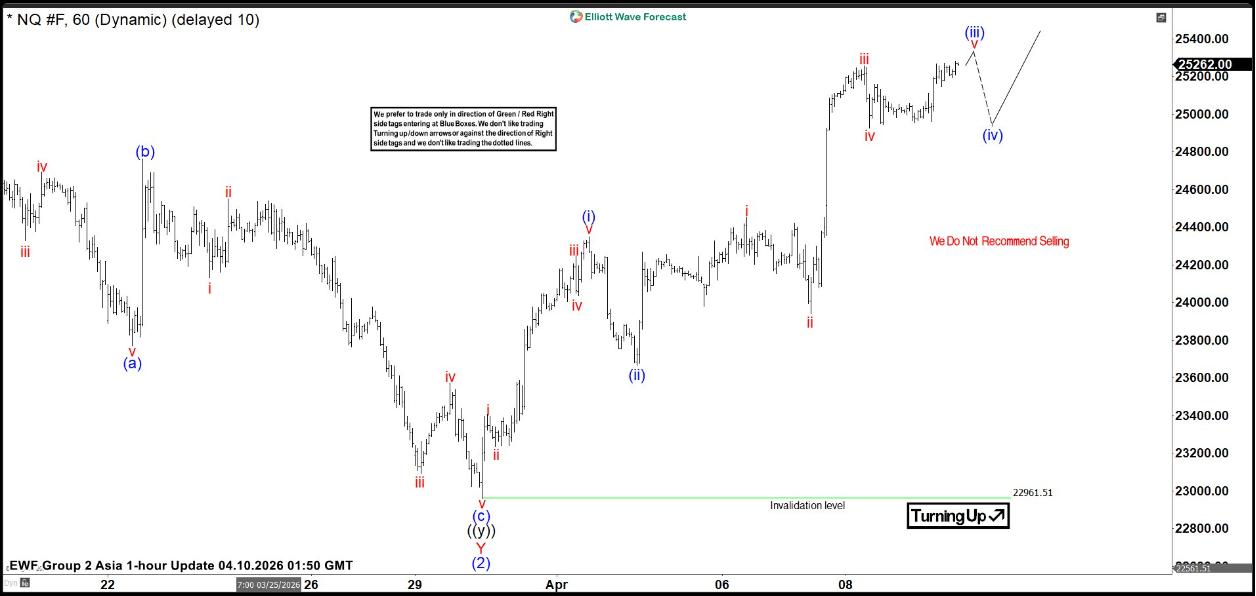
Nasdaq Futures (NQ) reached an all‑time high on October 30, 2025 at 26,399, which we identify as the completion of wave (1). The market then entered a corrective phase in wave (2), unfolding as a double‑three Elliott Wave structure. From the wave (1) peak, wave W declined to 23,904.5. A recovery in wave X followed and reached 26,349. The final leg lower in wave Y ended at 22,961.5, completing wave (2) in a higher degree.

With the correction finished, the Index has turned higher in wave (3). It still needs to break above the wave (1) high at 26,399 to fully rule out a double correction. From the wave (2) low, wave (i) advanced to 24,348.25. A pullback in wave (ii) then found support at 23,666. The Index is now progressing within wave (iii), which is expected to complete soon. A pullback in wave (iv) should follow before another advance in wave (v) to finish wave ((i)).

Once wave ((i)) ends, the Index should correct the cycle from the March 31 low in wave ((ii)). This would set the stage for another bullish phase. In the near term, the pivot at 22,961.5 remains a key level. As long as this level holds, any pullback should attract buyers in a three‑ or seven‑swing sequence, supporting the broader upside outlook.

Nasdaq Futures 60-minute Elliott Wave chart

Nasdaq Elliott Wave [Video]

Youtube preview

Author

Elliott Wave Forecast Team

Elliott Wave Forecast Team

ElliottWave-Forecast.com

More from Elliott Wave Forecast Team
Share:

Editor's Picks

GBP/USD bounces off lows, back above 1.3200

After bottoming out near 1.3160, GBP/USD manages to regain a bit of shine and reclaim the 1.3200 mark and beyond at the end of the week. Stronger-than-expected UK Retail Sales data seem to be helping the British Pound limit its losses, while the chaotic UK political environment keeps the bulls at bay for now.

EUR/USD looks consolidative around 1.1460

EUR/USD stages a modest rebound after slipping to a three-month low below 1.1420 at the end of the week. That said, the pair now looks to consolidate humble gains just above 1.1460 despite growing uncertainty surrounding the next round of US-Iran negotiations, which keeps the US Dollar’s downside contained.

Gold slips back to six-day lows, targets $4,100

Gold retreats for the third consecutive day on Friday, eroding gains seen in the first half of the week and approaching the key $4,100 mark per troy ounce. Indeed, the precious metal continues to face headwinds from the Fed's hawkish stance and renewed uncertainty surrounding the next round of US-Iran negotiations.

Solana extends correction despite ETF inflows, RWA adoption

Solana (SOL) price edges below $70 extending its losses for the fourth straight day this week. The institutional demand for Solana is building, with steady inflows so far this week and Morgan Stanley’s amended S-1 filing for a Solana-focused Exchange-Traded Fund.

The Iran war didn't break the US economy, but what happens next?

Nearly four months after the start of the Iran war, the US economy remains remarkably resilient. While the conflict initially triggered a severe disruption to global energy markets and a sharp rise in Oil prices, recent diplomatic progress between Washington and Tehran has eased concerns about a prolonged supply shock.

Regime change: Inside Kevin Warsh's first move to make the Fed unreadable on purpose

The rate did not move. That was the least interesting thing about Kevin Warsh's first meeting in charge of the Fed. The FOMC held its benchmark at 3.50%-3.75% for the fourth straight meeting, exactly as priced, and then the new chair used his first press conference to dismantle the machinery the market has leaned on for a decade.