Breaking: ISM Manufacturing PMI rose to 52.7 in March
- The US ISM Manufacturing PMI picked up pace in March.
- The US Dollar remains well on the back foot on Wednesday.

The Institute for Supply Management’s (ISM) data showed the Manufacturing PMI edging higher to 52.7 in March, up from 52.4 in February and above analysts’ expectations of 52.5.
Meanwhile, the Prices Paid Index, which tracks inflation, rose to 78.3 from 70.5, the Employment Index weakened a tad to 48.7 from 48.8, and the New Orders Index deflated to 53.5, from 55.8.
Market reaction
The Greenback extends its downbeat performance on Wednesday, motivating the US Dollar Index (DXY) to hit new multi-day lows around the 99.40 zone and add to Tuesday’s marked decline.
US Dollar Price Today
The table below shows the percentage change of US Dollar (USD) against listed major currencies today. US Dollar was the strongest against the Japanese Yen.
| USD | EUR | GBP | JPY | CAD | AUD | NZD | CHF | |
|---|---|---|---|---|---|---|---|---|
| USD | -0.47% | -0.62% | -0.02% | -0.10% | -0.58% | -0.28% | -0.69% | |
| EUR | 0.47% | -0.15% | 0.46% | 0.38% | -0.11% | 0.20% | -0.23% | |
| GBP | 0.62% | 0.15% | 0.61% | 0.52% | 0.05% | 0.35% | -0.06% | |
| JPY | 0.02% | -0.46% | -0.61% | -0.07% | -0.53% | -0.26% | -0.64% | |
| CAD | 0.10% | -0.38% | -0.52% | 0.07% | -0.46% | -0.18% | -0.59% | |
| AUD | 0.58% | 0.11% | -0.05% | 0.53% | 0.46% | 0.32% | -0.14% | |
| NZD | 0.28% | -0.20% | -0.35% | 0.26% | 0.18% | -0.32% | -0.41% | |
| CHF | 0.69% | 0.23% | 0.06% | 0.64% | 0.59% | 0.14% | 0.41% |
The heat map shows percentage changes of major currencies against each other. The base currency is picked from the left column, while the quote currency is picked from the top row. For example, if you pick the US Dollar from the left column and move along the horizontal line to the Japanese Yen, the percentage change displayed in the box will represent USD (base)/JPY (quote).
This section below was published as a preview of the US ISM Manufacturing PMI for March at 13:00 GMT.
- The US ISM Manufacturing PMI is expected to tick lower in March from the previous 52.4.
- Investors will pay attention to the Prices and Employment subindexes ahead of the NFP release.
- EUR/USD is under pressure and could test 2026 lows with encouraging US data.
The Institute for Supply Management (ISM) is scheduled to release the March Manufacturing Purchasing Managers’ Index (PMI) on Wednesday. Market participants anticipate it would ease modestly to 52.3 from the 52.4 posted in February.
The index is a trusted measure of the health of the United States (US) manufacturing sector, closely followed by market players. It is based on a survey conducted by ISM among companies around the US. The index revolves around the 50 threshold: a reading above it indicates an expanding sector, while a reading below it indicates contraction.
What to expect from the ISM manufacturing PMI report?
The February ISM report showed that economic activity in the manufacturing sector remained in expansion territory, but eased from the January print of 52.6. Still, “economic activity in the manufacturing sector expanded in February for the second straight month but only the third time in 40 months,” according to the official report, indicating the sector is still struggling to overcome the COVID-19 pandemic setback.
The ISM Manufacturing PMI report also shows that the New Orders Index expanded for the second straight month in February after four straight readings in contraction, registering 55.8, down from January’s figure of 57.1. The Prices Index increased to 70.5 from January’s reading of 59, and its highest reading since June 2022, while the Employment Index ticked higher to 48.8 from 48.1 in the previous month.
"Of the six largest manufacturing industries, four (Chemical Products; Machinery; Transportation Equipment; and Computer & Electronic Products) expanded in February", Susan Spence, Chair of the ISM Manufacturing Business Survey Committee, said.
Market participants will not only look at the headline for sectoral expansion or contraction, but also at the inflation and employment sub-indexes. As noted above, the Prices Index hit its highest in almost four years in February, before United States (US) President Donald Trump decided to join forces with Israel to attack Iran, resulting in a massive increase in Oil prices, which in turn triggered global inflation concerns.
Also, the employment-related component gains relevance ahead of the Nonfarm Payrolls (NFP) report, scheduled for release on Friday. Employment has become less of a concern in shaping the Federal Reserve's (Fed) monetary policy decisions, but it would still affect investors’ perception of the central bank's next move.
Finally, the headline reading will be responsible for the initial market reaction. Generally speaking, a better-than-anticipated outcome, with a reading above the 50 threshold, should boost demand for the US Dollar (USD), as it would both signal economic progress and increased odds of an upcoming interest rate hike. The opposite scenario is also valid, with a discouraging result putting pressure on the Greenback and boosting bets on an on-hold Fed.
When will the ISM Manufacturing PMI report be released and how could it affect EUR/USD?
The ISM Manufacturing PMI report is scheduled for release at 14:00 GMT on Wednesday. Ahead of the release, the US Dollar (USD) retains its safe-haven-inspired strength across the FX board, putting a pause on its rally. The EUR/USD pair trades around the 1.1500 mark, retaining its bearish bias according to technical readings in the daily chart.
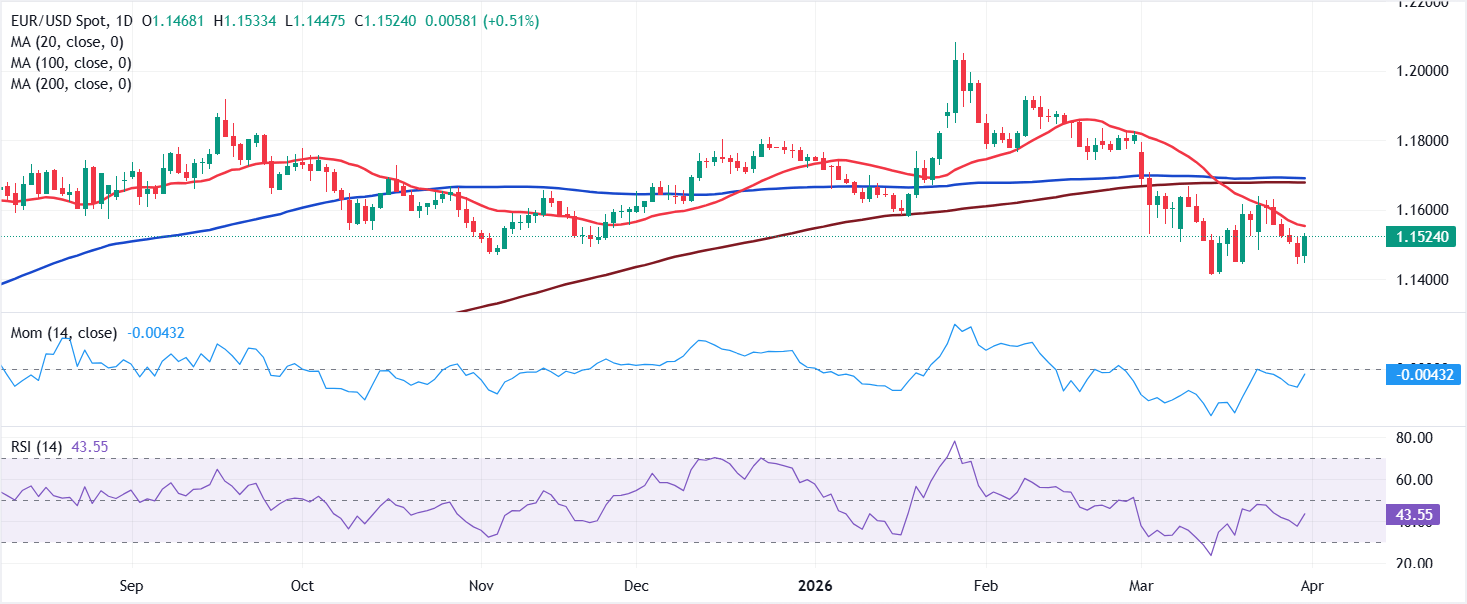
Valeria Bednarik, FXStreet Chief Analyst, notes: “The EUR/USD pair is at risk of retesting its 2026 low of 1.1411 in the upcoming sessions, given persistent war-related concerns and anticipated encouraging macroeconomic data. From a technical standpoint, sellers are in control. The daily chart for EUR/USD shows technical indicators aiming south within negative levels, while the pair develops below a now flat 20-day Simple Moving Average (SMA) currently around 1.1670. The weekly peak on Monday was set a handful of pips below the latter, reinforcing the idea of selling interest aligned sound it.”
Bednarik adds: “An upbeat ISM report could push EUR/USD towards the monthly low, with a break below it exposing the 1.1360 region. A discouraging reading could help EUR/USD advance temporarily, with resistance at 1.1560, the 1.1600 area and finally at 1.1670. Given dominant USD demand, however, and advance towards the latter seems unlikely, and any temporal gain will likely attract fresh bearish interest.”
US Dollar FAQs
The US Dollar (USD) is the official currency of the United States of America, and the ‘de facto’ currency of a significant number of other countries where it is found in circulation alongside local notes. It is the most heavily traded currency in the world, accounting for over 88% of all global foreign exchange turnover, or an average of $6.6 trillion in transactions per day, according to data from 2022. Following the second world war, the USD took over from the British Pound as the world’s reserve currency. For most of its history, the US Dollar was backed by Gold, until the Bretton Woods Agreement in 1971 when the Gold Standard went away.
The most important single factor impacting on the value of the US Dollar is monetary policy, which is shaped by the Federal Reserve (Fed). The Fed has two mandates: to achieve price stability (control inflation) and foster full employment. Its primary tool to achieve these two goals is by adjusting interest rates. When prices are rising too quickly and inflation is above the Fed’s 2% target, the Fed will raise rates, which helps the USD value. When inflation falls below 2% or the Unemployment Rate is too high, the Fed may lower interest rates, which weighs on the Greenback.
In extreme situations, the Federal Reserve can also print more Dollars and enact quantitative easing (QE). QE is the process by which the Fed substantially increases the flow of credit in a stuck financial system. It is a non-standard policy measure used when credit has dried up because banks will not lend to each other (out of the fear of counterparty default). It is a last resort when simply lowering interest rates is unlikely to achieve the necessary result. It was the Fed’s weapon of choice to combat the credit crunch that occurred during the Great Financial Crisis in 2008. It involves the Fed printing more Dollars and using them to buy US government bonds predominantly from financial institutions. QE usually leads to a weaker US Dollar.
Quantitative tightening (QT) is the reverse process whereby the Federal Reserve stops buying bonds from financial institutions and does not reinvest the principal from the bonds it holds maturing in new purchases. It is usually positive for the US Dollar.
Economic Indicator
ISM Manufacturing PMI
The Institute for Supply Management (ISM) Manufacturing Purchasing Managers Index (PMI), released on a monthly basis, is a leading indicator gauging business activity in the US manufacturing sector. The indicator is obtained from a survey of manufacturing supply executives based on information they have collected within their respective organizations. Survey responses reflect the change, if any, in the current month compared to the previous month. A reading above 50 indicates that the manufacturing economy is generally expanding, a bullish sign for the US Dollar (USD). A reading below 50 signals that factory activity is generally declining, which is seen as bearish for USD.
Read more.Next release: Wed Apr 01, 2026 14:00
Frequency: Monthly
Consensus: 52.3
Previous: 52.4
Source: Institute for Supply Management
The Institute for Supply Management’s (ISM) Manufacturing Purchasing Managers Index (PMI) provides a reliable outlook on the state of the US manufacturing sector. A reading above 50 suggests that the business activity expanded during the survey period and vice versa. PMIs are considered to be leading indicators and could signal a shift in the economic cycle. Stronger-than-expected prints usually have a positive impact on the USD. In addition to the headline PMI, the Employment Index and the Prices Paid Index numbers are watched closely as they shine a light on the labour market and inflation.
Author

FXStreet Team
FXStreet
Composed of a group of economic journalists and FX experts, the FXStreet content team produces and oversees all content published on FXStreet. It provides a purely journalistic approach to the Forex market.