|

Gold Price Analysis: XAU/USD sideways, trading near $1730/oz

  • XAU/USD is consolidating gains at the start of the new trading week. 
  • The level to beat for bulls is the 1740 resistance.
 

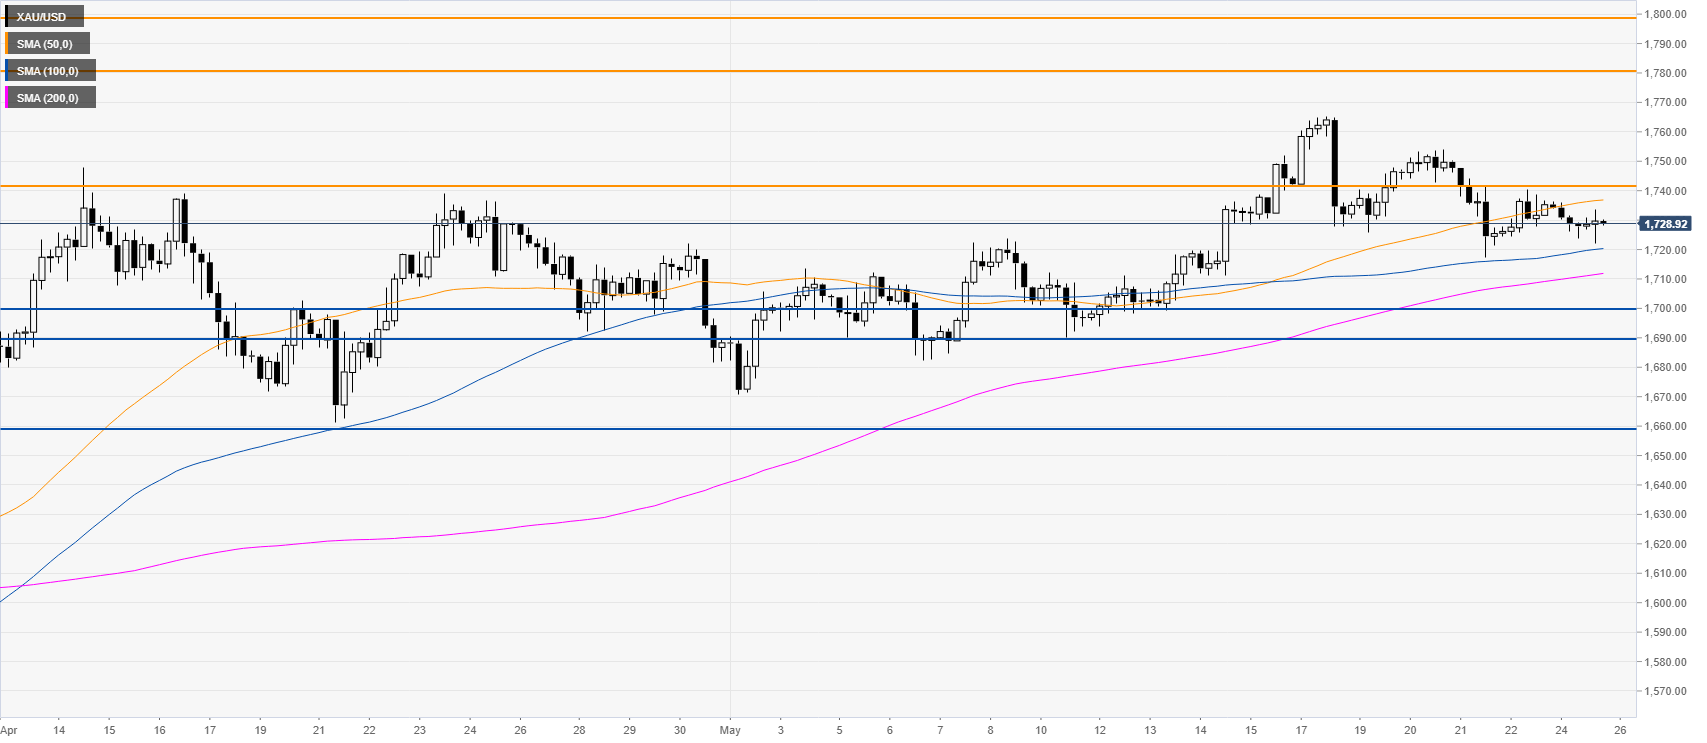
XAU/USD four-hour chart

 
XAU/USD is consolidating the recent gains while hovering above $1700 per troy ounce and the main SMAs on the four-hour chart. Gold bulls need a break above the 1740 resistance to move towards the 1780/1800 price zone. Occasional retracements down should find support near the 1690/1700 price zone and the 1660 level. 


Additional key levels

XAU/USD

Overview
Today last price1728.77
Today Daily Change-5.45
Today Daily Change %-0.31
Today daily open1734.22
 
Trends
Daily SMA201715.66
Daily SMA501663.44
Daily SMA1001626.42
Daily SMA2001559.69
 
Levels
Previous Daily High1740.43
Previous Daily Low1724.46
Previous Weekly High1765.38
Previous Weekly Low1717.34
Previous Monthly High1747.82
Previous Monthly Low1568.46
Daily Fibonacci 38.2%1734.33
Daily Fibonacci 61.8%1730.56
Daily Pivot Point S11725.64
Daily Pivot Point S21717.07
Daily Pivot Point S31709.67
Daily Pivot Point R11741.61
Daily Pivot Point R21749.01
Daily Pivot Point R31757.58

Author

Flavio Tosti

Flavio Tosti

Independent Analyst


More from Flavio Tosti
Share:

Markets move fast. We move first.

Orange Juice Newsletter brings you expert driven insights - not headlines. Every day on your inbox.

By subscribing you agree to our Terms and conditions.

Editor's Picks

EUR/USD hovers around 1.1700, US Jobless Claims data eyed

EUR/USD is trading in a range around 1.1700 in European trading on Thursday. The pair's upside remains capped by a pause in the US Dollar decline, led by the less hawkish Fed outcome. Markets await the release of the US weekly Initial Jobless Claims report for further trading incentives. 

GBP/USD struggles below 1.3400 ahead of US employment data

GBP/USD stays defensive below 1.3400 in the European session on Thursday, pressured by a modest US Dollar upswing. Nonetheless, the potential downside might be limited after the US Federal Reserve delivered a rate cut at its December policy meeting. Traders brace for the US weekly Initial Jobless Claims report due later in the day. 

Gold bounces off $4,200 neighborhood, down a little amid mixed fundamental cues

Gold recovers slightly from the vicinity of the $4,200 mark, though it sticks to its negative bias through the first half of the European session. The US Dollar attracts some buyers and recovers a part of the previous day's post-FOMC slump to its lowest level since October 24. This fails to assist the commodity in capitalizing on its modest intraday uptick to the weekly high.

Solana dips as hawkish Fed cuts dampen market sentiment

Solana price is trading below $130 on Thursday, after being rejected at the upper boundary of its falling wedge pattern. The broader market weakness following the Federal Reserve’s hawkish rate cut has added to downside momentum.

Fed projects only 50 bps of additional rate cuts between 2026 and 2027; lifts GDP forecasts

The Federal Open Market Committee’s (FOMC) latest dot plot, released on Wednesday, indicates that interest rates will average 3.4% by the end of 2026, in line with the September projection.

Solana dips as hawkish Fed cuts dampen market sentiment
Solana (SOL) price is trading below $130 at the time of writing on Thursday, after being rejected at the upper boundary of its falling wedge pattern. The broader market weakness following the Federal Reserve’s hawkish rate cut has added to downside momentum.