- XAU/USD bulls see further upside amid US stimulus optimism.
- Bull flag, bullish RSI on the 15-minutes chart favor the buyers.
- All eyes on Biden’s stimulus talks and silver’s price action.
Gold (XAU/USD) is set to retest daily highs at $1867, having found strong bids around $1850 levels amid a revival of hopes on a likely US fiscal stimulus.
The risk sentiment received a fresh boost alongside gold prices, as the US dollar eased across the board after reports that US President Joe Biden is expected to meet a group of Republican senators later on Monday to discuss the covid relief package. The Republicans have trimmed down the stimulus package to $600 million.
The Wall Street retail-trade frenzy and the ongoing rally in silver prices also keep the sentiment around gold underpinned. Although, the vaccine optimism in the Euro area could limit the gains in the bright metal.
Gold Price Chart: 15-minutes
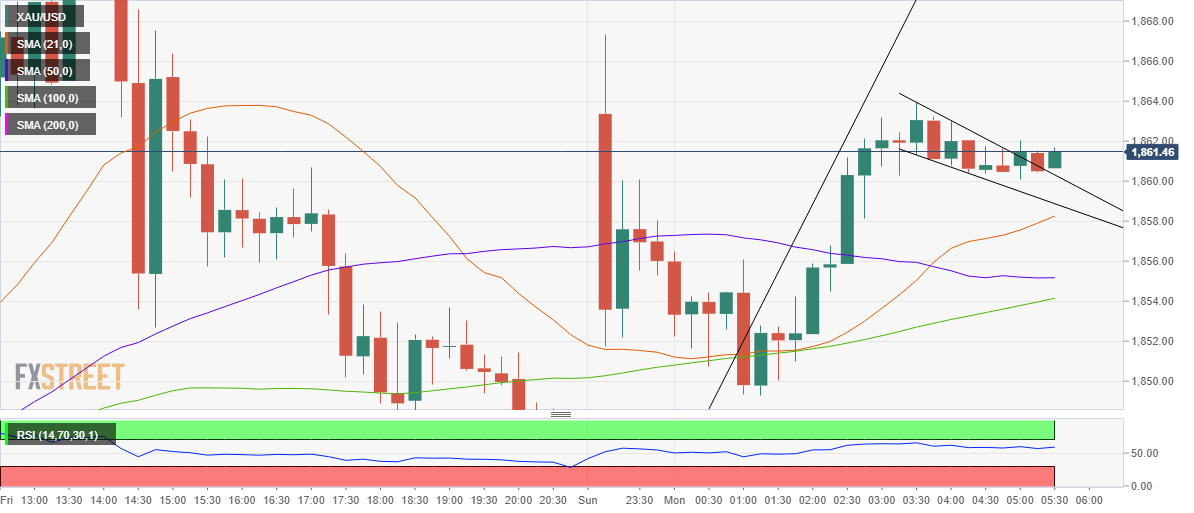
Looking at it technically, the near-term bias appears bullish amid a bull flag confirmed on the 15-minutes chart on the last candle.
The Relative Strength Index (RSI) holds steady above the midline, suggesting that there is additional room to the upside.
The spot trades above all the major averages on the given timeframe, having witnessed a bullish crossover earlier in the Asian session. The 21-simple moving average (SMA) cut the 50-HMA from below represents a bull cross.
A break below the falling trendline support at $1858 could invalidate the pattern, opening floors for a test of the 50-SMA at $1855.
Gold Additional levels
Information on these pages contains forward-looking statements that involve risks and uncertainties. Markets and instruments profiled on this page are for informational purposes only and should not in any way come across as a recommendation to buy or sell in these assets. You should do your own thorough research before making any investment decisions. FXStreet does not in any way guarantee that this information is free from mistakes, errors, or material misstatements. It also does not guarantee that this information is of a timely nature. Investing in Open Markets involves a great deal of risk, including the loss of all or a portion of your investment, as well as emotional distress. All risks, losses and costs associated with investing, including total loss of principal, are your responsibility. The views and opinions expressed in this article are those of the authors and do not necessarily reflect the official policy or position of FXStreet nor its advertisers. The author will not be held responsible for information that is found at the end of links posted on this page.
If not otherwise explicitly mentioned in the body of the article, at the time of writing, the author has no position in any stock mentioned in this article and no business relationship with any company mentioned. The author has not received compensation for writing this article, other than from FXStreet.
FXStreet and the author do not provide personalized recommendations. The author makes no representations as to the accuracy, completeness, or suitability of this information. FXStreet and the author will not be liable for any errors, omissions or any losses, injuries or damages arising from this information and its display or use. Errors and omissions excepted.
The author and FXStreet are not registered investment advisors and nothing in this article is intended to be investment advice.
Recommended content
Editors’ Picks
EUR/USD clings to daily gains above 1.0650

EUR/USD gained traction and turned positive on the day above 1.0650. The improvement seen in risk mood following the earlier flight to safety weighs on the US Dollar ahead of the weekend and helps the pair push higher.
GBP/USD recovers toward 1.2450 after UK Retail Sales data

GBP/USD reversed its direction and advanced to the 1.2450 area after touching a fresh multi-month low below 1.2400 in the Asian session. The positive shift seen in risk mood on easing fears over a deepening Iran-Israel conflict supports the pair.
Gold holds steady at around $2,380 following earlier spike

Gold stabilized near $2,380 after spiking above $2,400 with the immediate reaction to reports of Israel striking Iran. Meanwhile, the pullback seen in the US Treasury bond yields helps XAU/USD hold its ground.
Bitcoin Weekly Forecast: BTC post-halving rally could be partially priced in Premium

Bitcoin price shows no signs of directional bias while it holds above $60,000. The fourth BTC halving is partially priced in, according to Deutsche Bank’s research.
Week ahead – US GDP and BoJ decision on top of next week’s agenda

US GDP, core PCE and PMIs the next tests for the Dollar. Investors await BoJ for guidance about next rate hike. EU and UK PMIs, as well as Australian CPIs also on tap.