- GBP/USD fades bounces off intraday low, stays pressured around weekly bottom.
- Fortnight-old resistance line, 100-EMA guard immediate run-up, RSI hints at sideways grind.
- Weekly support line restricts downside targeting yearly low.
GBP/USD licks its wounds around 1.2250 while fading the recent bounce off intraday low during Thursday’s Asian session. Even so, the cable pair remains pressured below the short-term key resistances.
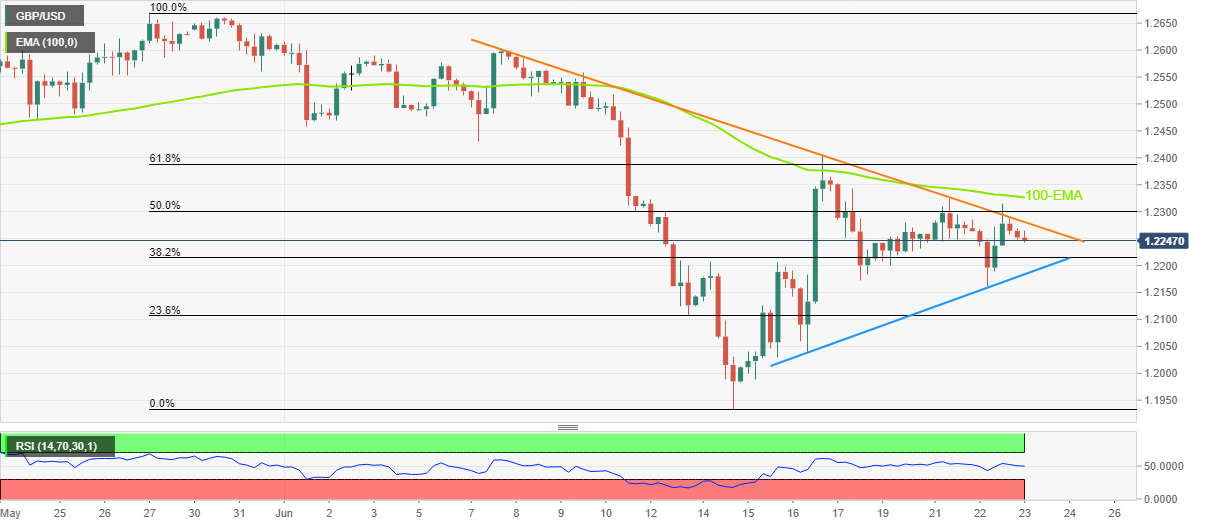
In addition to the nearby hurdles, sluggish RSI (14) also weighs on the GBP/USD prices. However, an upward sloping support line from last Thursday, near 1.2180, puts a floor under the pair.
That said, a 12-day-old resistance line, at 1.2280 by the press time, guards the Cable pair’s immediate upside ahead of the 100-EMA level near 1.2330. Following that, the mid-June peak surrounding 1.2410 could lure the bulls.
It’s worth noting that there are multiple hurdles surrounding 1.2430 and 1.2470 that could challenge GBP/USD bulls past-1.2410.
Meanwhile, a downside break of the 1.2180, could avail the 1.2100 and the 1.2000 round figures as intermediate halts during the south run targeting the yearly low of 1.1933.
In a case where the GBP/USD bears dominate past 1.1933, the year 2016 low near 1.1900 may act as the last defense of the buyers before directing the quote to March 2020 bottom surrounding 1.1410.
Overall, GBP/USD is likely to extend the bearish grind towards the latest trough.
GBP/USD: Four-hour chart
Trend: Bearish
Information on these pages contains forward-looking statements that involve risks and uncertainties. Markets and instruments profiled on this page are for informational purposes only and should not in any way come across as a recommendation to buy or sell in these assets. You should do your own thorough research before making any investment decisions. FXStreet does not in any way guarantee that this information is free from mistakes, errors, or material misstatements. It also does not guarantee that this information is of a timely nature. Investing in Open Markets involves a great deal of risk, including the loss of all or a portion of your investment, as well as emotional distress. All risks, losses and costs associated with investing, including total loss of principal, are your responsibility. The views and opinions expressed in this article are those of the authors and do not necessarily reflect the official policy or position of FXStreet nor its advertisers. The author will not be held responsible for information that is found at the end of links posted on this page.
If not otherwise explicitly mentioned in the body of the article, at the time of writing, the author has no position in any stock mentioned in this article and no business relationship with any company mentioned. The author has not received compensation for writing this article, other than from FXStreet.
FXStreet and the author do not provide personalized recommendations. The author makes no representations as to the accuracy, completeness, or suitability of this information. FXStreet and the author will not be liable for any errors, omissions or any losses, injuries or damages arising from this information and its display or use. Errors and omissions excepted.
The author and FXStreet are not registered investment advisors and nothing in this article is intended to be investment advice.
Recommended content
Editors’ Picks
AUD/USD could extend the recovery to 0.6500 and above

The enhanced risk appetite and the weakening of the Greenback enabled AUD/USD to build on the promising start to the week and trade closer to the key barrier at 0.6500 the figure ahead of key inflation figures in Australia.
EUR/USD now refocuses on the 200-day SMA

EUR/USD extended its positive momentum and rose above the 1.0700 yardstick, driven by the intense PMI-led retracement in the US Dollar as well as a prevailing risk-friendly environment in the FX universe.
Gold struggles around $2,325 despite broad US Dollar’s weakness

Gold reversed its direction and rose to the $2,320 area, erasing a large portion of its daily losses in the process. The benchmark 10-year US Treasury bond yield stays in the red below 4.6% following the weak US PMI data and supports XAU/USD.
Bitcoin price makes run for previous cycle highs as Morgan Stanley pushes BTC ETF exposure

Bitcoin (BTC) price strength continues to grow, three days after the fourth halving. Optimism continues to abound in the market as Bitcoiners envision a reclamation of previous cycle highs.
US versus the Eurozone: Inflation divergence causes monetary desynchronization

Historically there is a very close correlation between changes in US Treasury yields and German Bund yields. This is relevant at the current juncture, considering that the recent hawkish twist in the tone of the Federal Reserve might continue to push US long-term interest rates higher and put upward pressure on bond yields in the Eurozone.