GBP/JPY Price Forecast: Bulls defend 100-day SMA while momentum remains subdued
- GBP/JPY edges higher on Friday as the Japanese Yen remains on the defensive amid ongoing energy shocks in the Middle East.
- The British Pound holds firm while traders assess the political fallout from UK local elections.
- Technically, the pair maintains a constructive outlook above the 100-day and 200-day SMAs.

GBP/JPY edges higher on Friday as the Japanese Yen (JPY) continues to face selling pressure despite suspected intervention by Japanese authorities earlier this week. At the time of writing, the cross is trading around 213.31, up nearly 0.30% on the day after reversing part of the losses registered earlier this week.
The Japanese Yen is struggling to gain traction amid elevated Oil prices and ongoing supply disruptions through the Strait of Hormuz. A significant portion of Japan’s energy imports comes from the Middle East, leaving the economy particularly vulnerable to rising import costs and slower economic growth.
Meanwhile, the British Pound (GBP) is holding firm across the board as investors assess the political landscape following the UK local elections, where Prime Minister Keir Starmer’s Labour Party reportedly suffered notable losses.
That said, GBP/JPY’s broader uptrend remains intact due to the wide interest rate differential between the Bank of England (BoE) and the Bank of Japan (BoJ). With ongoing energy shocks raising inflation risks, this divergence could widen further as expectations grow that central banks may need to raise interest rates to contain inflationary pressure.
Technical Analysis:
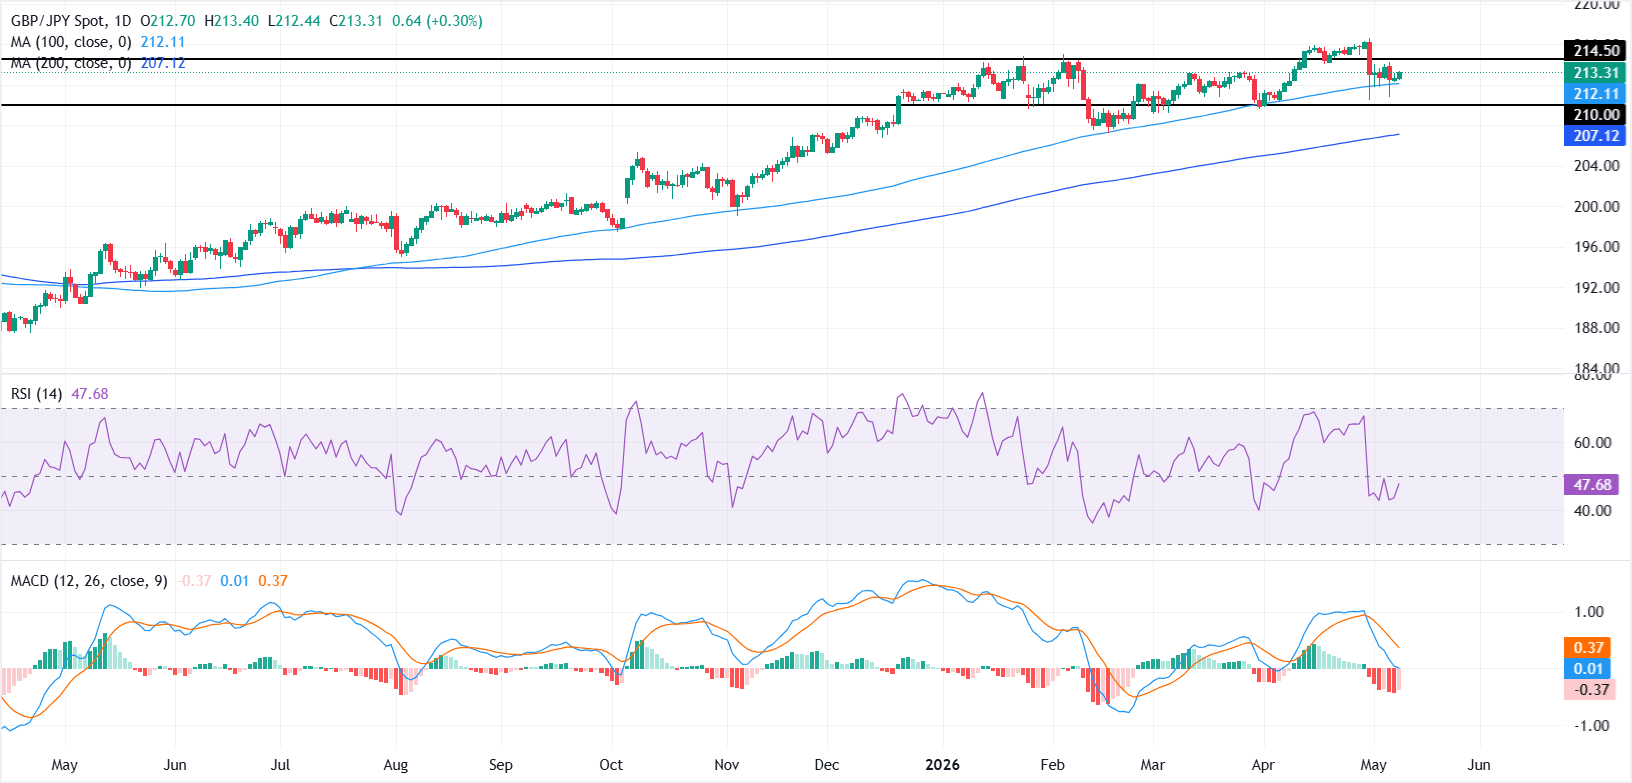
On the daily chart, GBP/JPY holds a constructive bias as it remains above both the 100-day Simple Moving Average (SMA) at 212.11 and the longer-term 200-day SMA at 207.12. Price is consolidating just under the nearby horizontal barrier at 214.50, suggesting the broader uptrend is intact but facing topside friction, while a soft Relative Strength Index (RSI) near 47 and a negative Moving Average Convergence Divergence (MACD) reading hint at waning bullish momentum in the very near term.
On the topside, immediate resistance is located at 214.50, and a clear daily close above this level would reopen the path to further gains. On the downside, initial support is seen at the 100-day SMA at 212.11, followed by the horizontal floor at 210.00, with the 200-day SMA at 207.12 reinforcing a deeper medium-term demand zone if the pullback extends.
(The technical analysis of this story was written with the help of an AI tool.)
Author

Vishal Chaturvedi
FXStreet
I am a macro-focused research analyst with over four years of experience covering forex and commodities market. I enjoy breaking down complex economic trends and turning them into clear, actionable insights that help traders stay ahead of the curve.