- GBP/JPY refreshes intraday low but stays inside a one-week-old symmetrical triangle.
- Preliminary readings of Q2 Japan GDP appeared softer-than-forecast but improved from prior readings.
- 200-HMA restricts immediate upside but nearly oversold RSI hints at limited downside room.
GBP/JPY renews daily bottom near 161.60 after Japan’s Q2 GDP flashed softer than expected figures during the initial hour of Monday’s Asian session. Even so, the cross-currency pair remains inside a one-week-old symmetrical triangle, keeping the traders less interested despite the latest move.
That said, preliminary readings of Japan’s Q2 GDP appeared at 0.5% QoQ versus 0.6% expected and -0.1% prior. Further, the GDP Annualized eased below 2.5% expected to 2.2%, versus -0.5% prior.
It’s worth noting that the quote’s latest weakness also portrays the bear’s dominance below the 200-HMA, suggesting further downside.
However, the RSI (14) line is nearly oversold and the GBP/JPY appears close to the stated triangle’s support line, around 161.30, which in turn signals limited room to the south for the pair sellers to cheer.
In a case where GBP/JPY remains weak past 161.30, the 161.00 threshold and the monthly low of 159.44 will be in focus.
Alternatively, a successful break of the 200-HMA level surrounding 162.35 could propel the buyers towards the stated triangle’s upper line, at 163.25 by the press time.
Following that, the monthly peak of around 164.00 will be important to watch for GBP/JPY buyers.
GBP/JPY: Hourly chart
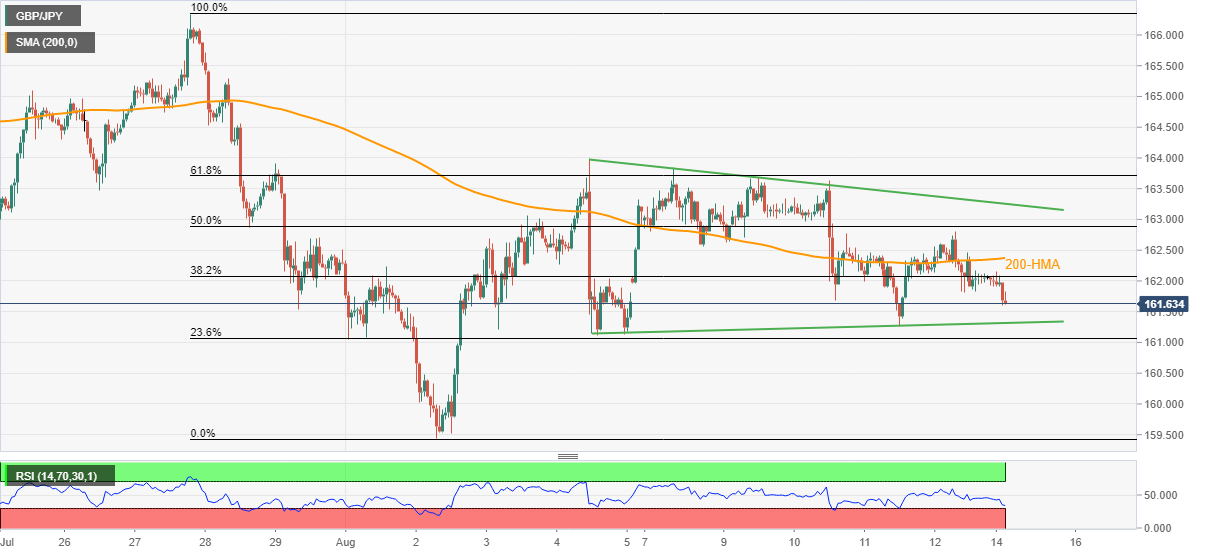
Trend: Sideways
Information on these pages contains forward-looking statements that involve risks and uncertainties. Markets and instruments profiled on this page are for informational purposes only and should not in any way come across as a recommendation to buy or sell in these assets. You should do your own thorough research before making any investment decisions. FXStreet does not in any way guarantee that this information is free from mistakes, errors, or material misstatements. It also does not guarantee that this information is of a timely nature. Investing in Open Markets involves a great deal of risk, including the loss of all or a portion of your investment, as well as emotional distress. All risks, losses and costs associated with investing, including total loss of principal, are your responsibility. The views and opinions expressed in this article are those of the authors and do not necessarily reflect the official policy or position of FXStreet nor its advertisers. The author will not be held responsible for information that is found at the end of links posted on this page.
If not otherwise explicitly mentioned in the body of the article, at the time of writing, the author has no position in any stock mentioned in this article and no business relationship with any company mentioned. The author has not received compensation for writing this article, other than from FXStreet.
FXStreet and the author do not provide personalized recommendations. The author makes no representations as to the accuracy, completeness, or suitability of this information. FXStreet and the author will not be liable for any errors, omissions or any losses, injuries or damages arising from this information and its display or use. Errors and omissions excepted.
The author and FXStreet are not registered investment advisors and nothing in this article is intended to be investment advice.
Recommended content
Editors’ Picks
EUR/USD rises toward 1.0700 after Germany and EU PMI data

EUR/USD gains traction and rises toward 1.0700 in the European session on Monday. HCOB Composite PMI data from Germany and the Eurozone came in better than expected, providing a boost to the Euro. Focus shifts US PMI readings.
GBP/USD holds above 1.2350 after UK PMIs

GBP/USD clings to modest daily gains above 1.2350 in the European session on Tuesday. The data from the UK showed that the private sector continued to grow at an accelerating pace in April, helping Pound Sterling gather strength.
Gold price flirts with $2,300 amid receding safe-haven demand, reduced Fed rate cut bets

Gold price (XAU/USD) remains under heavy selling pressure for the second straight day on Tuesday and languishes near its lowest level in over two weeks, around the $2,300 mark heading into the European session.
Here’s why Ondo price hit new ATH amid bearish market outlook Premium

Ondo price shows no signs of slowing down after setting up an all-time high (ATH) at $1.05 on March 31. This development is likely to be followed by a correction and ATH but not necessarily in that order.
US S&P Global PMIs Preview: Economic expansion set to keep momentum in April

S&P Global Manufacturing PMI and Services PMI are both expected to come in at 52 in April’s flash estimate, highlighting an ongoing expansion in the private sector’s economic activity.