- GBP/JPY hovers around intraday high during the first positive day in three.
- Bullish chart pattern on 4H needs validation, 50-SMA adds strength to resistance.
- Key Fibonacci retracement levels, 200-SMA act as an additional downside filters.
GBP/JPY seesaws near the daily top of 156.06, up 0.24% intraday heading into Thursday’s London open.
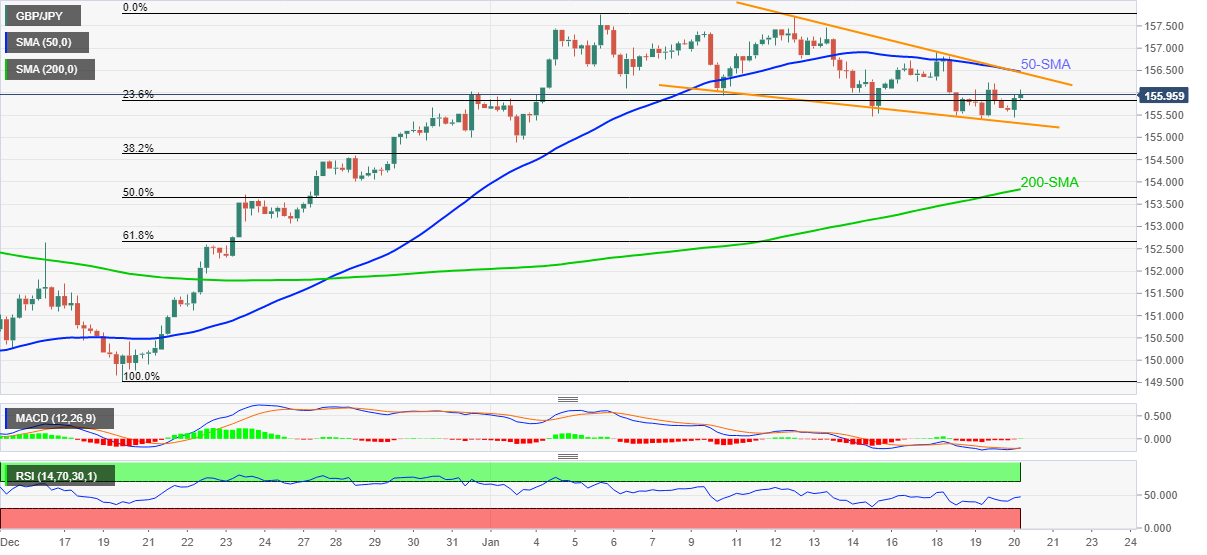
The cross-currency pair rises for the first time in three days while picking up bids inside an eight-day-old falling wedge bearish chart pattern.
Given the gradually rising MACD line from the bearish territory, coupled with the firmer RSI, the GBP/JPY rebound is likely to last longer.
Though, a convergence of the 50-SMA and the upper line of the stated wedge, near 156.50, becomes crucial resistance for the GBP/JPY bulls to watch.
Should the quote rises past 156.50, the monthly high of 157.76 will act as a buffer during the theoretically anticipated rally towards crossing the 2021 peak of 158.22.
On the flip side, the wedge’s support line near 155.35 limits the short-term downside of GBP/JPY ahead of 50% Fibonacci retracement (Fibo.) of December-January upside, near 153.65.
Also challenging the GBP/JPY bears is the 200-SMA level near 153.80, as well as 61.8% Fibo. of 152.67.
Overall, GBP/JPY is up for further advances and the bullish chart pattern hints at the quote’s rally past the 2021 peak until it stays above 200-SMA.
GBP/JPY: Four-hour chart
Trend: Further upside expected
Information on these pages contains forward-looking statements that involve risks and uncertainties. Markets and instruments profiled on this page are for informational purposes only and should not in any way come across as a recommendation to buy or sell in these assets. You should do your own thorough research before making any investment decisions. FXStreet does not in any way guarantee that this information is free from mistakes, errors, or material misstatements. It also does not guarantee that this information is of a timely nature. Investing in Open Markets involves a great deal of risk, including the loss of all or a portion of your investment, as well as emotional distress. All risks, losses and costs associated with investing, including total loss of principal, are your responsibility. The views and opinions expressed in this article are those of the authors and do not necessarily reflect the official policy or position of FXStreet nor its advertisers. The author will not be held responsible for information that is found at the end of links posted on this page.
If not otherwise explicitly mentioned in the body of the article, at the time of writing, the author has no position in any stock mentioned in this article and no business relationship with any company mentioned. The author has not received compensation for writing this article, other than from FXStreet.
FXStreet and the author do not provide personalized recommendations. The author makes no representations as to the accuracy, completeness, or suitability of this information. FXStreet and the author will not be liable for any errors, omissions or any losses, injuries or damages arising from this information and its display or use. Errors and omissions excepted.
The author and FXStreet are not registered investment advisors and nothing in this article is intended to be investment advice.
Recommended content
Editors’ Picks
EUR/USD consolidates gains below 1.0700 amid upbeat mood

EUR/USD is consolidating its recovery below 1.0700 in the European session on Thursday. The US Dollar holds its corrective decline amid improving market mood, despite looming Middle East geopolitical risks. Speeches from ECB and Fed officials remain on tap.
GBP/USD clings to moderate gains above 1.2450 on US Dollar weakness

GBP/USD is clinging to recovery gains above 1.2450 in European trading on Thursday. The pair stays supported by a sustained US Dollar weakness alongside the US Treasury bond yields. Risk appetite also underpins the higher-yielding currency pair. ahead of mid-tier US data and Fedspeak.
Gold price shines amid fears of fresh escalation in Middle East tensions

Gold price rebounds to $2,380 in Thursday’s European session after posting losses on Wednesday. The precious metal holds gains amid fears that Middle East tensions could worsen and spread beyond Gaza if Israel responds brutally to Iran.
Ripple faces significant correction as former SEC litigator says lawsuit could make it to Supreme Court

Ripple (XRP) price hovers below the key $0.50 level on Thursday after failing at another attempt to break and close above the resistance for the fourth day in a row.
Have we seen the extent of the Fed rate repricing?

Markets have been mostly consolidating recent moves into Thursday. We’ve seen some profit taking on Dollar longs and renewed demand for US equities into the dip. Whether or not this holds up is a completely different story.