- GBP/JPY nosedived to fresh 4-month lows below 160.00, though buyers reclaimed the 160.00 figure.
- A decisive break below 160.00 could pave the way towards 158.00; otherwise, a re-test of 161.00 is on the cards.
The GBP/JPY slightly advanced, following Thursday’s volatile session, after the Bank of Japan (BoJ) decided to hold rates unchanged but intervene in the FX market, sending the USD/JPY tumbling from around 145.90 to 140.34 after emphasizing that the Japanese yen weakness, was not aligned with fundamentals. Consequently, the GBP/JPY dropped 1.34% on Thursday, but at the time of writing is trading at 160.25, up 0.05%.
GBP/JPY Price Analysis: Technical outlook
The GBP/JPY price action illustrates the pair tumbling below the 200-day EMA, hitting a fresh four-month-low at around 159.12; buyers stepped in and reclaimed the previously-mentioned 200-day EMA at 160.27. Traders should note that the Relative Strength Index (RSI) fell below the midline, extending its fall towards the 36.46 reading, suggesting that sellers are in charge. Therefore, the GBP/JPY is downward biased. Once it clears the 200-day EMA, a re-test of the 159.00 area is on the cards.
In the short term, the 4-hour chart illustrates that the GBP/JPY reached the head-and-shoulders chart pattern target at around 161.50; the downtrend extended towards the four-month low before recovering to 160.00. Nevertheless, the GBP/JPY bias shifted downwards, further cemented by the cross of the 20-EMA below the 200 one.
Therefore, the GBP/JPY’s first support would be the 160.00 psychological price level. The break below will expose the four-month low at 159.12, followed by 159.00, ahead of the S1 daily pivot at 158.07.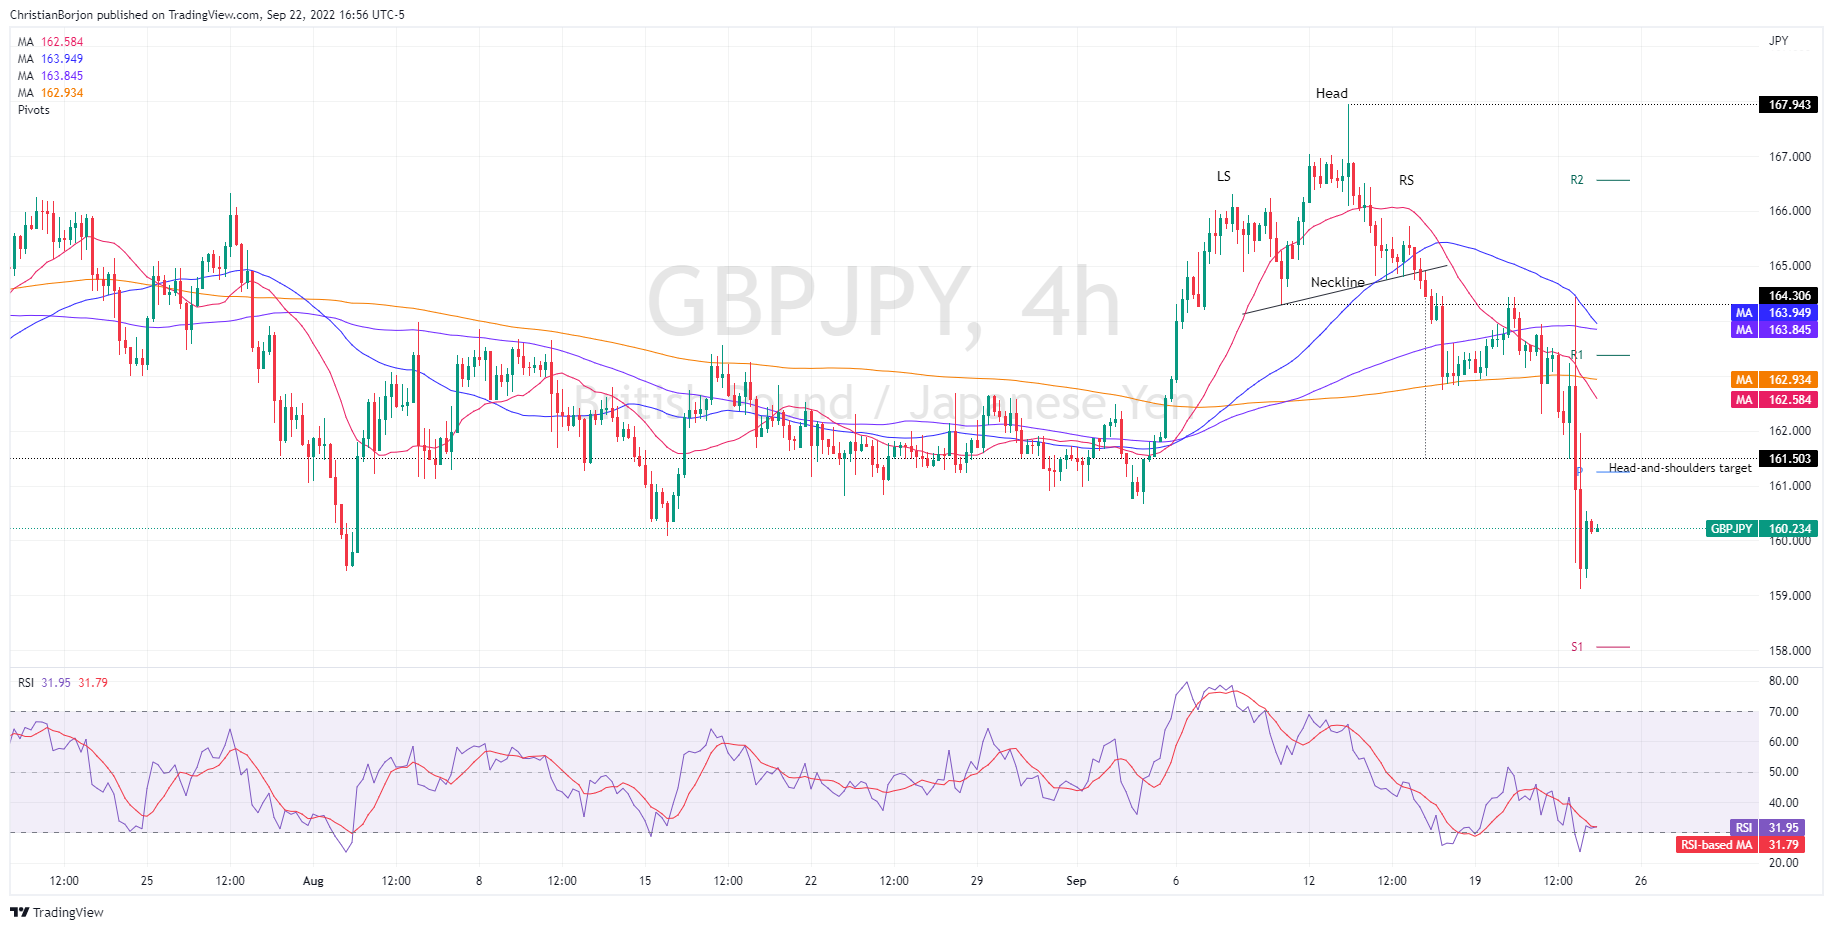
GBP/JPY Key Technical Levels
Information on these pages contains forward-looking statements that involve risks and uncertainties. Markets and instruments profiled on this page are for informational purposes only and should not in any way come across as a recommendation to buy or sell in these assets. You should do your own thorough research before making any investment decisions. FXStreet does not in any way guarantee that this information is free from mistakes, errors, or material misstatements. It also does not guarantee that this information is of a timely nature. Investing in Open Markets involves a great deal of risk, including the loss of all or a portion of your investment, as well as emotional distress. All risks, losses and costs associated with investing, including total loss of principal, are your responsibility. The views and opinions expressed in this article are those of the authors and do not necessarily reflect the official policy or position of FXStreet nor its advertisers. The author will not be held responsible for information that is found at the end of links posted on this page.
If not otherwise explicitly mentioned in the body of the article, at the time of writing, the author has no position in any stock mentioned in this article and no business relationship with any company mentioned. The author has not received compensation for writing this article, other than from FXStreet.
FXStreet and the author do not provide personalized recommendations. The author makes no representations as to the accuracy, completeness, or suitability of this information. FXStreet and the author will not be liable for any errors, omissions or any losses, injuries or damages arising from this information and its display or use. Errors and omissions excepted.
The author and FXStreet are not registered investment advisors and nothing in this article is intended to be investment advice.
Recommended content
Editors’ Picks
EUR/USD holds above 1.0650 after US data

EUR/USD retreats from session highs but manages to hold above 1.0650 in the early American session. Upbeat macroeconomic data releases from the US helps the US Dollar find a foothold and limits the pair's upside.
GBP/USD retreats toward 1.2450 on modest USD rebound

GBP/USD edges lower in the second half of the day and trades at around 1.2450. Better-than-expected Jobless Claims and Philadelphia Fed Manufacturing Index data from the US provides a support to the USD and forces the pair to stay on the back foot.
Gold is closely monitoring geopolitics

Gold trades in positive territory above $2,380 on Thursday. Although the benchmark 10-year US Treasury bond yield holds steady following upbeat US data, XAU/USD continues to stretch higher on growing fears over a deepening conflict in the Middle East.
Ripple faces significant correction as former SEC litigator says lawsuit could make it to Supreme Court

Ripple (XRP) price hovers below the key $0.50 level on Thursday after failing at another attempt to break and close above the resistance for the fourth day in a row.
Have we seen the extent of the Fed rate repricing?

Markets have been mostly consolidating recent moves into Thursday. We’ve seen some profit taking on Dollar longs and renewed demand for US equities into the dip. Whether or not this holds up is a completely different story.