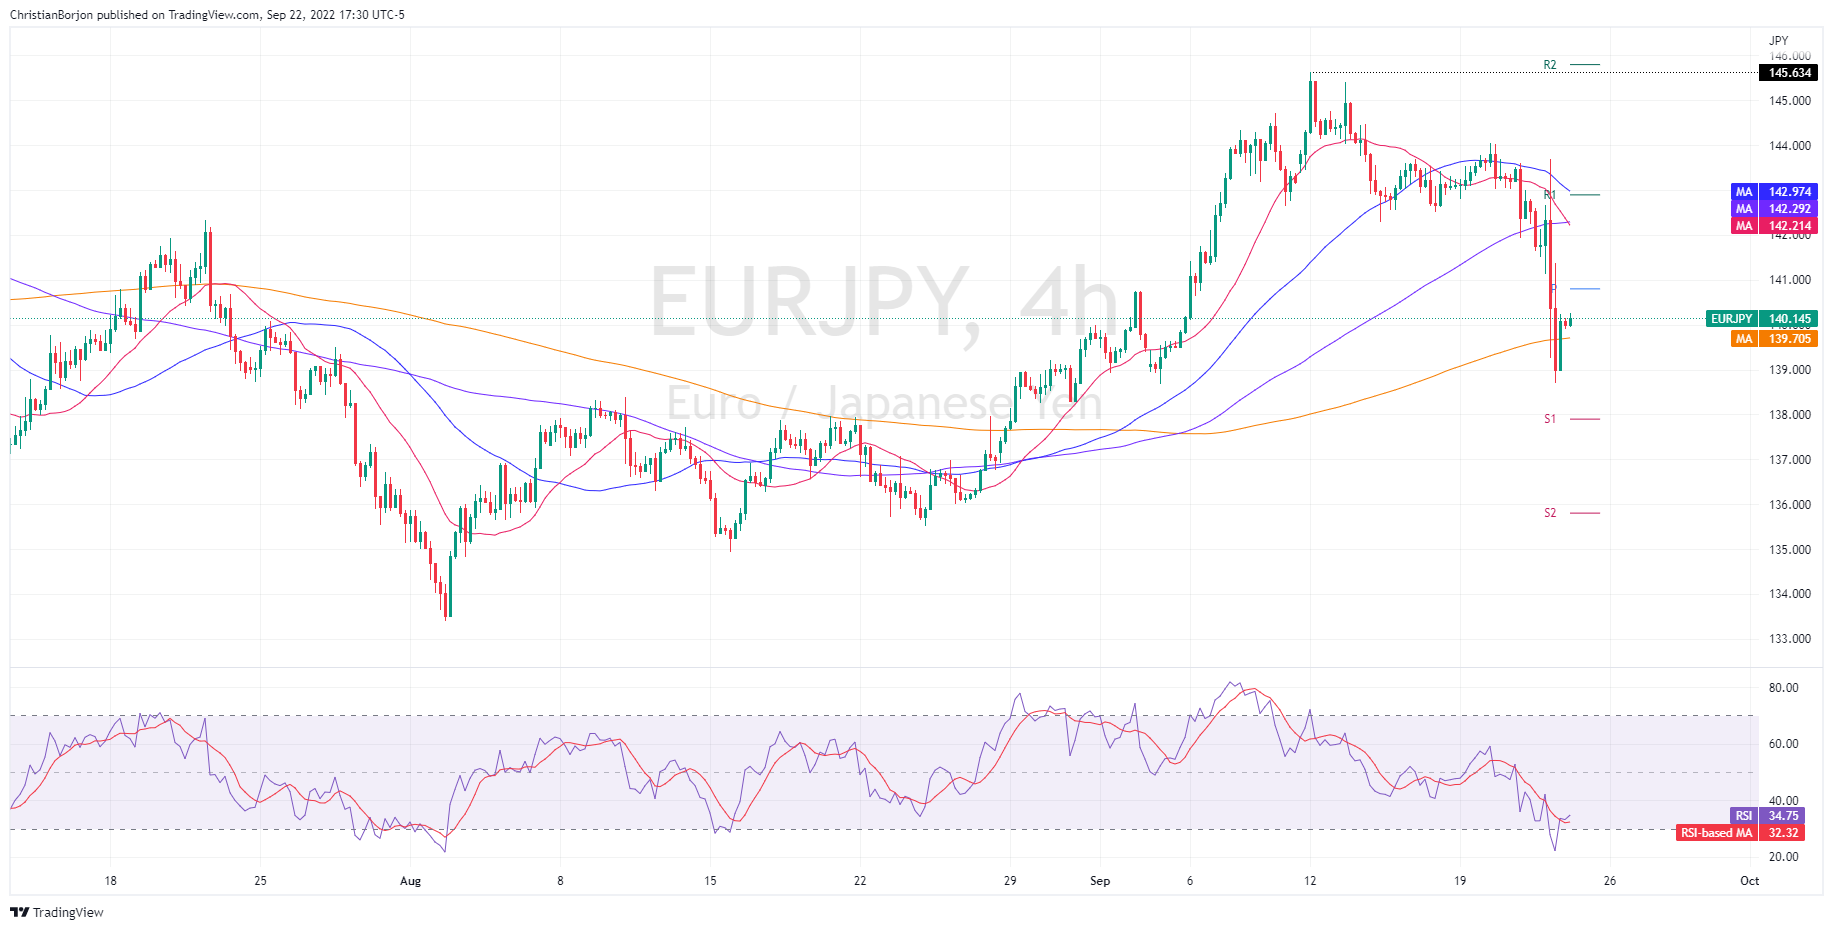
- EUR/JPY reached a fresh monthly low at around 138.70, though it trimmed some losses.
- Sellers in the EUR/JPY daily and 4-hour chart are gathering momentum, as shown by the RSI.
- EUR/JPY Price Analysis: in the 4-hour chart, a break below 140.00 could pave the way toward 138.00.
The EUR/JPY dropped to fresh monthly lows at around 138.70, though a confluence of moving averages (MAs), namely the 50 and 100-day EMA meandering around the 139.16/19 area, were difficult hurdles to surpass, while bulls moving in helped to re-conquer the 140.00 psychological level. As the Asian Pacific session begins, the EUR/JPY is trading at 140.13, up by 0.11%.
EUR/JPY Price Analysis: Technical outlook
On Thursday, the cross-currency pair seesawed in a 500 pip range as the Bank of Japan (BoJ) intervention in the USD/JPY sent most yen crosses nosediving sharply. Even though the EUR/JPY remains above the 50 and 100-day EMAs, oscillators, particularly the Relative Strength Index (RSI), fell to negative territory, suggesting that sellers are gathering momentum.
The GBP/JPY four-hour chart shows the 20-EM crossing under the 50 and 100-EMAs, keeping the downward bias intact, though failure to record a daily close below the 200-EMA, staying above 139.98, opened the door towards 140.00. Albeit the EUR/JPY is trading above 140.00, risks are skewed to the downside, as the RSI persists in negative territory, alongside buyers needing to step in and lift prices above the 141.00 price level.
Therefore, the EUR/JPY first support would be the 140.00 figure. Once cleared, the next support would be the 200-EMA at 139.70, followed by the 139.00 psychological level, ahead of the S1 pivot at 138.00. On the flip side, the EUR/JPY first resistance would be the daily pivot at 140.81. The break above will immediately expose the 141.00 figure, which, if cleared, could pave the way toward 142.00.
EUR/JPY Key Technical Levels
Information on these pages contains forward-looking statements that involve risks and uncertainties. Markets and instruments profiled on this page are for informational purposes only and should not in any way come across as a recommendation to buy or sell in these assets. You should do your own thorough research before making any investment decisions. FXStreet does not in any way guarantee that this information is free from mistakes, errors, or material misstatements. It also does not guarantee that this information is of a timely nature. Investing in Open Markets involves a great deal of risk, including the loss of all or a portion of your investment, as well as emotional distress. All risks, losses and costs associated with investing, including total loss of principal, are your responsibility. The views and opinions expressed in this article are those of the authors and do not necessarily reflect the official policy or position of FXStreet nor its advertisers. The author will not be held responsible for information that is found at the end of links posted on this page.
If not otherwise explicitly mentioned in the body of the article, at the time of writing, the author has no position in any stock mentioned in this article and no business relationship with any company mentioned. The author has not received compensation for writing this article, other than from FXStreet.
FXStreet and the author do not provide personalized recommendations. The author makes no representations as to the accuracy, completeness, or suitability of this information. FXStreet and the author will not be liable for any errors, omissions or any losses, injuries or damages arising from this information and its display or use. Errors and omissions excepted.
The author and FXStreet are not registered investment advisors and nothing in this article is intended to be investment advice.
Recommended content
Editors’ Picks
AUD/USD posts gain, yet dive below 0.6500 amid Aussie CPI, ahead of US GDP

The Aussie Dollar finished Wednesday’s session with decent gains of 0.15% against the US Dollar, yet it retreated from weekly highs of 0.6529, which it hit after a hotter-than-expected inflation report. As the Asian session begins, the AUD/USD trades around 0.6495.
USD/JPY finds its highest bids since 1990, approaches 156.00

USD/JPY broke into its highest chart territory since June of 1990 on Wednesday, peaking near 155.40 for the first time in 34 years as the Japanese Yen continues to tumble across the broad FX market.
Gold stays firm amid higher US yields as traders await US GDP data

Gold recovers from recent losses, buoyed by market interest despite a stronger US Dollar and higher US Treasury yields. De-escalation of Middle East tensions contributed to increased market stability, denting the appetite for Gold buying.
Ethereum suffers slight pullback, Hong Kong spot ETH ETFs to begin trading on April 30

Ethereum suffered a brief decline on Wednesday afternoon despite increased accumulation from whales. This follows Ethereum restaking protocol Renzo restaked ETH crashing from its 1:1 peg with ETH and increased activities surrounding spot Ethereum ETFs.
Dow Jones Industrial Average hesitates on Wednesday as markets wait for key US data

The DJIA stumbled on Wednesday, falling from recent highs near 38,550.00 as investors ease off of Tuesday’s risk appetite. The index recovered as US data continues to vex financial markets that remain overwhelmingly focused on rate cuts from the US Fed.