|

EUR/JPY Price Analysis: Euro losses ground against the yen and drops below 146.50

  • EUR/JPY edges slightly up as the Asian Pacific session begins.
  • The Euro weakened due to an adverse market sentiment spurred by recession fears.
  • Short term, the EUR/JPY could tumble towards 145.40 once it clears the 146.00 figure.

The EUR/JPY tumbled from weekly highs around 147.00, for fundamental reasons, like the Eurozone (EU) inflation report, with September’s CPI around 9.9% YoY, less than estimates but elevated. Also, expectations for further central bank tightening spurred concerns of a global recession as risk-perceived assets edged lower. Therefore, safe-haven peers, like the Japanese yen (JPY), appreciated against the Euro. At the time of writing, the EUR/JPY is trading at 146.44, almost flat, as the Asian session begins.

EUR/JPY Price Forecast

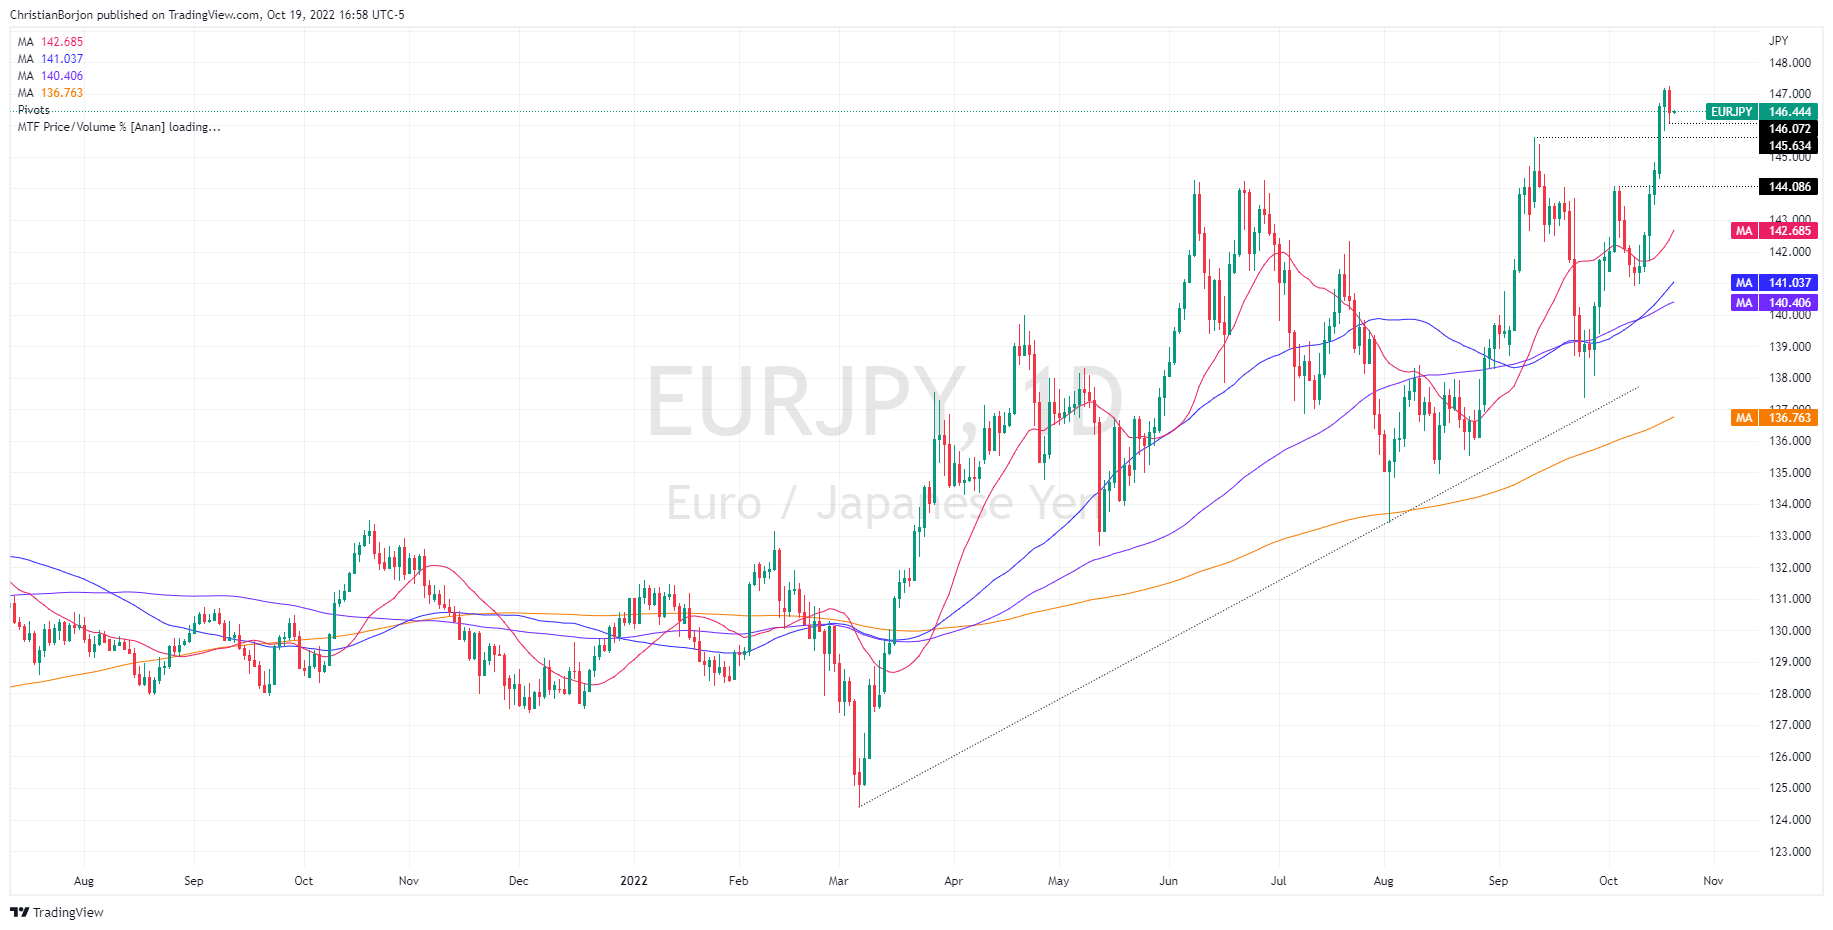
From a technical perspective, the EUR/JPY tested the YTD highs of 147.25 on Wednesday, though failure to hold the fort around the 147.00 figure exacerbated a drop towards the October 18 daily lows at 145.81. EUR/JPY traders should be aware that a bearish-harami candle chart pattern surfaced at the daily chart, warring downward action. Nevertheless, a break below October’s 18 daily low at 145.81 is needed to pave the way for further losses.

If that scenario plays out, the EUR/JPY first support would be the September 12 high-turned-support at 145.63. A breach of the latter will expose the 145.00 figure, followed by the October 5 swing high/support around 144.08.

EUR/JPY Daily Chart
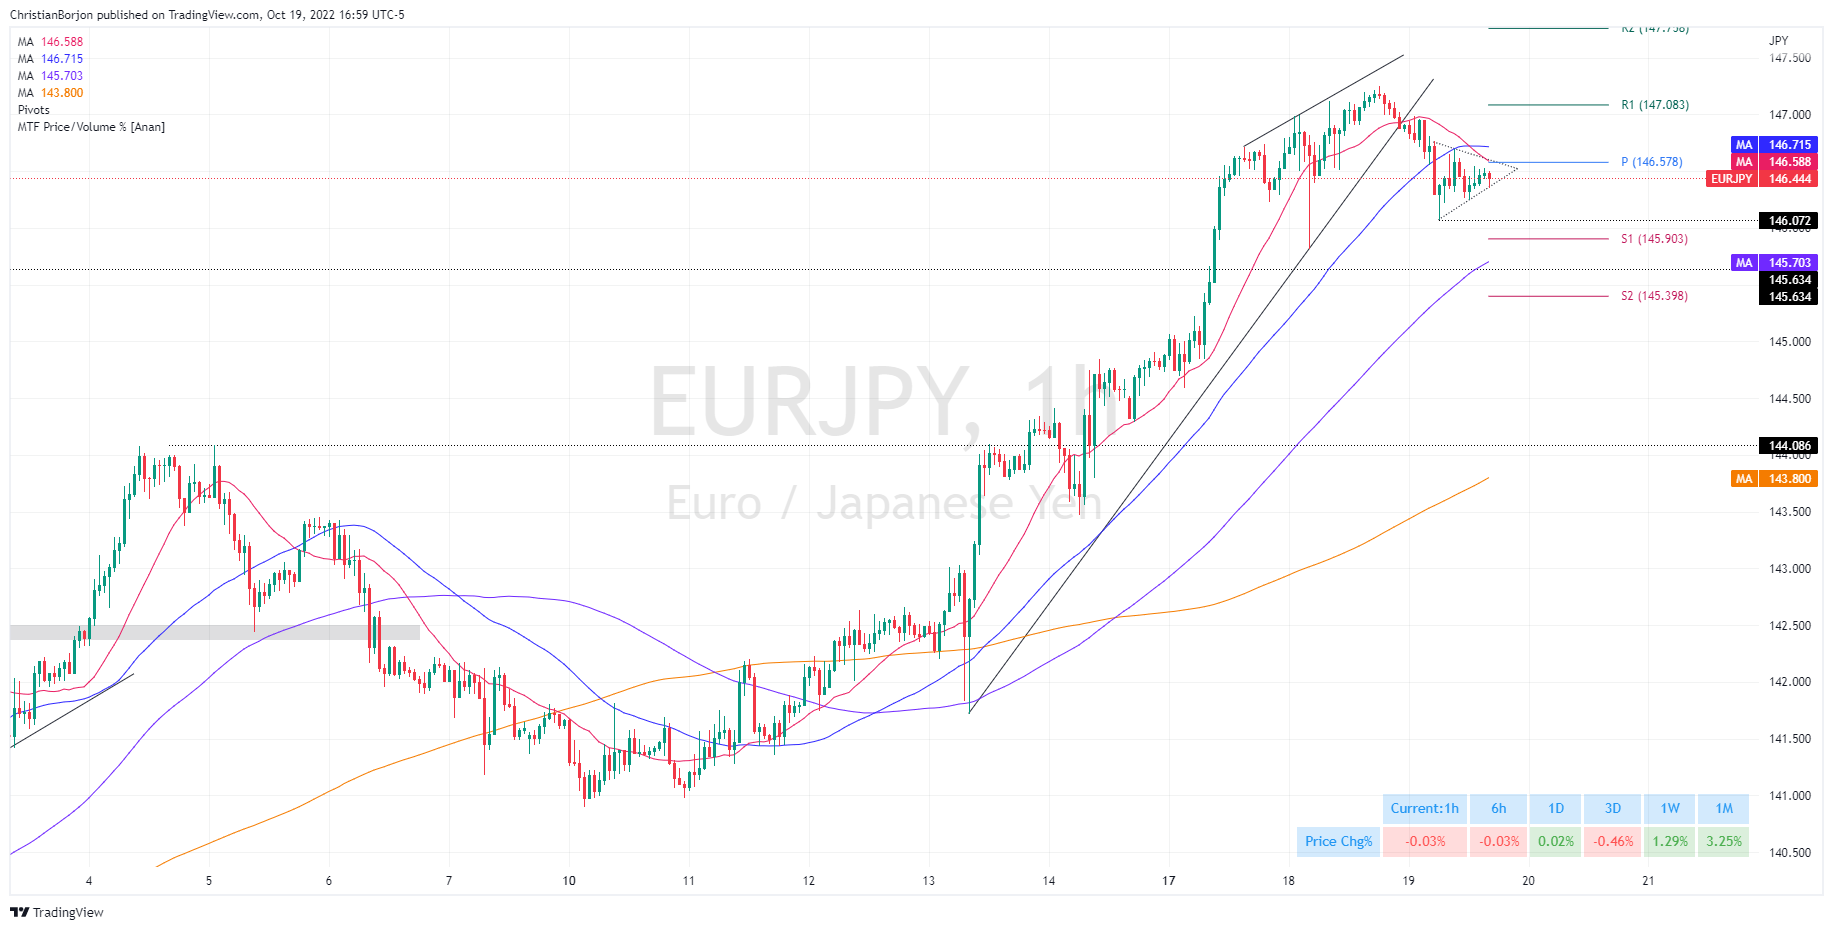
Near term, the EUR/JPY hourly chart illustrates the cross as neutral biased, with prices sliding below the 20 and 50-Exponential Moving Averages (EMAs), with the former crossing below the latter, opening the door for further losses. Notably, a symmetrical triangle on a downtrend surfaced, meaning that EUR/JPY risks are skewed to the downside.

Hence, the EUR/JPY first support would be October’s 19 daily low at 146.07. Break below will expose the S1 daily pivot point at 145.90, followed by the 100-EMA at 145.70, ahead of the S2 daily pivot level at 145.40.

EUR/JPY Hourly Chart
EUR/JPY

Overview
Today last price146.48
Today Daily Change-0.64
Today Daily Change %-0.44
Today daily open147.12
 
Trends
Daily SMA20142.17
Daily SMA50140.71
Daily SMA100140.3
Daily SMA200136.64
 
Levels
Previous Daily High147.2
Previous Daily Low145.82
Previous Weekly High144.85
Previous Weekly Low140.9
Previous Monthly High145.64
Previous Monthly Low137.38
Daily Fibonacci 38.2%146.67
Daily Fibonacci 61.8%146.35
Daily Pivot Point S1146.23
Daily Pivot Point S2145.34
Daily Pivot Point S3144.85
Daily Pivot Point R1147.61
Daily Pivot Point R2148.09
Daily Pivot Point R3148.98

Author

Christian Borjon Valencia

Markets analyst, news editor, and trading instructor with over 14 years of experience across FX, commodities, US equity indices, and global macro markets.


More from Christian Borjon Valencia
Share:

Editor's Picks

AUD/USD stays weak above 0.6900 after China’s trade data

AUD/USD struggles to capitalize on the previous day’s recovery and stays defensive on the 0.6900 level following the narrowing of trade surplus in China. Increased December Fed rate hike bets allows the US Dollar to pause its decline and weigh on the pair. US CPI data is next of note for the major.

USD/JPY retakes 158.00 on weak Japanese data; focus shifts to US CPI

USD/JPY attracts some dip-buyers and retakes 158.00 in the Asian session on Tuesday as a fall in Japan’s Household Spending offsets hawkish BoJ Summary of Opinions, undermining the Japanese Yen. Moreover, Fed hike bets support the safe-haven US Dollar and the currency pair. The market focus now shifts to the release of the crucial US CPI report.

Gold drifts lower as traders look to US CPI report for Fed rate cues amid Iran uncertainty

Gold meets with fresh supply, reversing a part of the previous day's strong move up to the $4,150 resistance zone amid a modest US Dollar uptick. Against the backdrop of firming US Federal Reserve rate hike expectations, mixed signals regarding the state of diplomatic talks between the US and Iran offer some support to the safe-haven Greenback. However, USD bulls seem hesitant and opt to wait on the sidelines ahead of US consumer inflation figures.

Bitcoin hits lowest weekly close since August as short-term holders slip into losses

Bitcoin fell below $75,000 on Tuesday, after recording its lowest weekly close since August as selling pressure pushed recent buyers into losses.

This weeks’ two big inflation reports will offer perspective

Payrolls on Friday surprised with a big gain, 165,000 new jobs rather than the 65,000 forecast. Also the unemployment rate fell from 4.2% to 4.1% although average hourly earnings are up only 0.4% ($32.75). This weeks’ two big inflation reports will offer perspective. Tomorrow it’s CPI and on Friday, which is a Friday the 13th, it’s PPI.

Gold reclaimed $4,100. Tuesday’s CPI test decides if it holds
Gold (XAU/USD) starts the week on a positive note, reclaiming the $4,100 psychological level as the US Dollar (USD) retreats from its recent highs. The precious metal recovers from Friday's losses, although investors remain cautious ahead of Tuesday's US Consumer Price Index (CPI) report, which could determine the next direction for Bullion.