|

EUR/GBP Price Analysis: rebounds from YTD low, as a bullish-engulfing pattern looms

  • EUR/GBP sees a significant bounce from YTD lows, climbing 70 pips and gaining 0.72%, spurred by rising EUR/USD.
  • A bullish engulfing candlestick pattern indicates the possibility of further upside for the EUR/GBP pair, targeting 0.8600.
  • Technical indicators, including the RSI and three-day RoC, show buyers gathering momentum, suggesting near-term bullishness.

EUR/GBP jumps from year-to-date (YTD) lows of 0.8504, climbs 70 pips, and gains 0.72% on Wednesday, underpinned by the rise of the EUR/USD pair. The EUR/GBP is exchanging hands at 0.8571 after hitting a daily low of 0.8505.

EUR/GBP Price Analysis: Technical outlook

After diving to a new YTD low of 0.8504, the EUR/GBP has risen sharply toward the 20-day Exponential Moving Average (EMA) at 0.8571. During the last couple of days, EUR/GBP’s price action formed a bullish engulfing candlestick pattern, suggesting further upside is expected; nevertheless, a daily close above the latter is needed to keep bulls’ hopes alive.

The EUR/GBP first supply zone to test would be the 0.8600 mark. Once cleared, the next stop will be the 50-day EMA at 0.8621, followed by the June 28 swing high at 0.8658. A breach of the latter will shift the cross-pair bias to neutral and expose key resistance levels. The next resistance will be the 200-day EMA at 0.8684, ahead of testing at 0.8700.

Notably, the Relative Strength Index (RSI) is about to turn bullish, while the three-day Rate of Change (RoC) depicts buyers gathering momentum. That said, the EUR/GBP is upward in the near term.

EUR/GBP Price Action – Daily chart
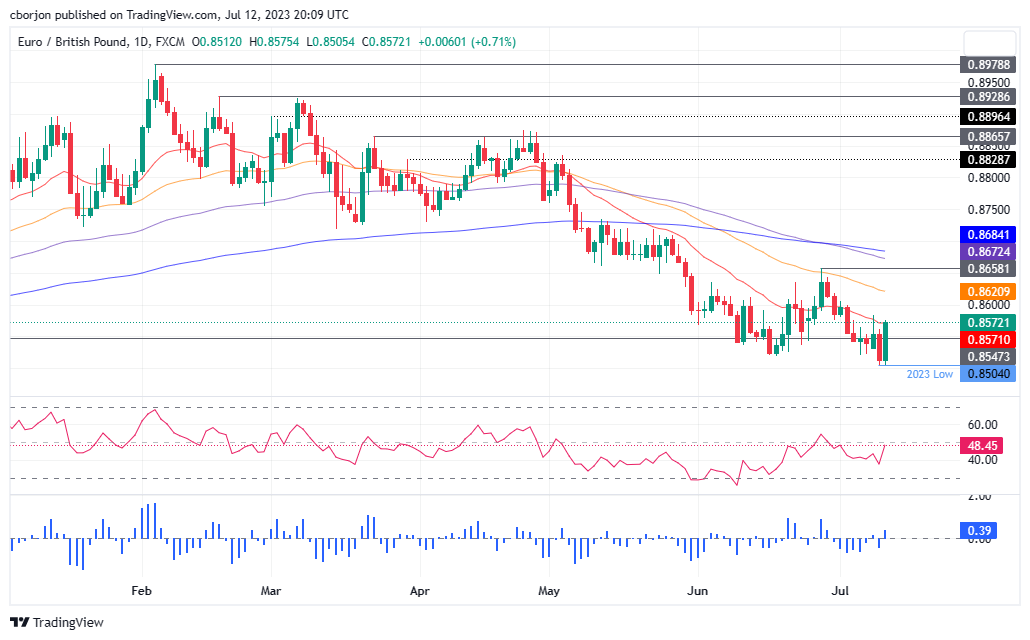
EUR/GBP Daily chart

EUR/GBP

Overview
Today last price0.8572
Today Daily Change0.0060
Today Daily Change %0.70
Today daily open0.8512
 
Trends
Daily SMA200.8569
Daily SMA500.8626
Daily SMA1000.872
Daily SMA2000.8735
 
Levels
Previous Daily High0.8561
Previous Daily Low0.8504
Previous Weekly High0.8606
Previous Weekly Low0.8521
Previous Monthly High0.8658
Previous Monthly Low0.8518
Daily Fibonacci 38.2%0.8526
Daily Fibonacci 61.8%0.8539
Daily Pivot Point S10.849
Daily Pivot Point S20.8469
Daily Pivot Point S30.8433
Daily Pivot Point R10.8548
Daily Pivot Point R20.8583
Daily Pivot Point R30.8605

Author

Christian Borjon Valencia

Markets analyst, news editor, and trading instructor with over 14 years of experience across FX, commodities, US equity indices, and global macro markets.


More from Christian Borjon Valencia
Share:

Editor's Picks

AUD/USD keeps the red near 0.6950 after weak Aussie jobs data

AUD/USD holds losses near 0.6950 on disappointing Australian jobs data, extending the previous day's retracement slide from the monthly high and hitting a fresh weekly low during Thursday’s Asian session. Meanwhile, declining US bond yields drag the US Dollar away from the April 2025 high, touched after Wednesday's hot US CPI, helping limit losses for the currency pair.

USD/JPY slides back below 158.00 as USD reverses post-CPI gains

USD/JPY extends the previous day's pullback from a three-week high, attracting follow-through selling and sliding below 158.00 during Thursday's Asian session. Traders remain on high alert amid speculation that authorities will step in to prop up the Japanese Yen. The US Dollar, meanwhile, reverses Wednesday's hot CPI-led gains to April 2025 highs as US bond yields retreat on China bond-buying talk, further pressuring the pair.

Gold rebounds to $4,150 as China bond-buying reports smash US yields

Gold attracts strong buying and retests $4,150 during the Asian session on Thursday, snapping a three-day losing streak to a one-week low. Retreating US bond yields drag the US Dollar away from the April 2025 high, touched in reaction to Wednesday’s hot US CPI report, and boost the non-yielding bullion. Reports that China is quietly buying US Treasuries through Canada are smashing US Treasury bond yields and the USD.

Bitcoin falls on hot CPI: Why $80,000 support matters

Bitcoin's (BTC) most critical level to watch is near $80,000 as September's hot inflation reading pressures the crypto market, according to Glassnode. The top crypto declined within minutes of the September Consumer Price Index (CPI) release, which showed a 3.7% annual increase in headline inflation, above forecasts of 3.6%. Core inflation, which excludes food and energy prices, came in at 2.6%.

China seems routing US Treasury holdings through Canada

According to a Bloomberg report, China seems to be moving United States securities to non-US custodian banks in other countries, masking its role in financing US deficits.

Has Bitcoin really escaped the macro forces it was built to fight?
Over 17 years ago, Satoshi Nakamoto designed Bitcoin (BTC) on the back of a global financial crisis as an alternative to the global monetary system outside the control of central banks, governments and traditional intermediaries. This raises a key question: has Bitcoin really become independent of the macroeconomic forces it was built to challenge?