Ethereum Price Forecast: ETH extends consolidation as bulls await a catalyst
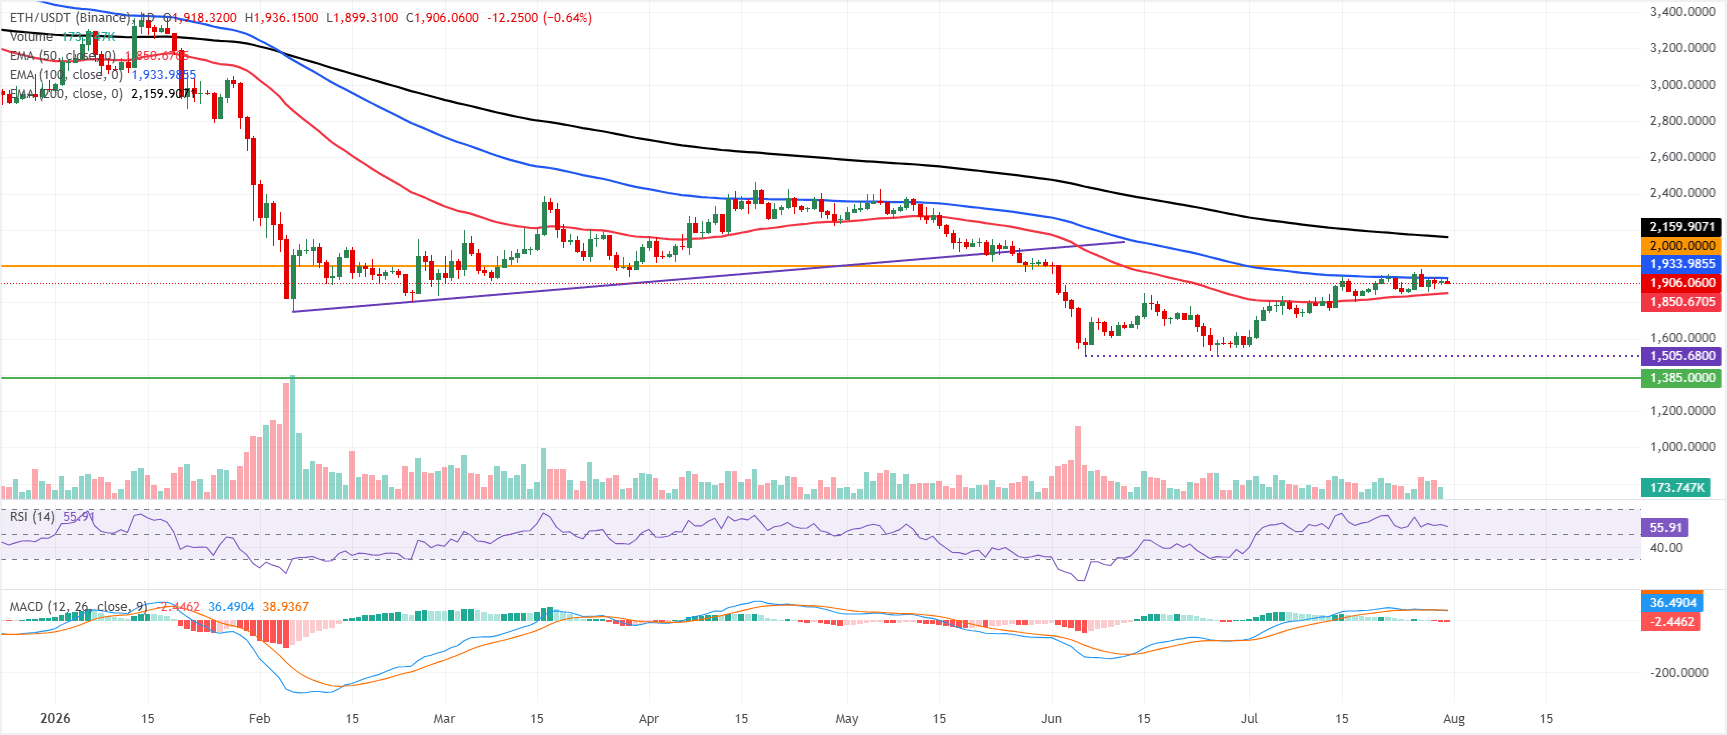
- Ethereum has been consolidating between the 50-day and 100-day EMAs since mid-July, signaling indecision among traders.
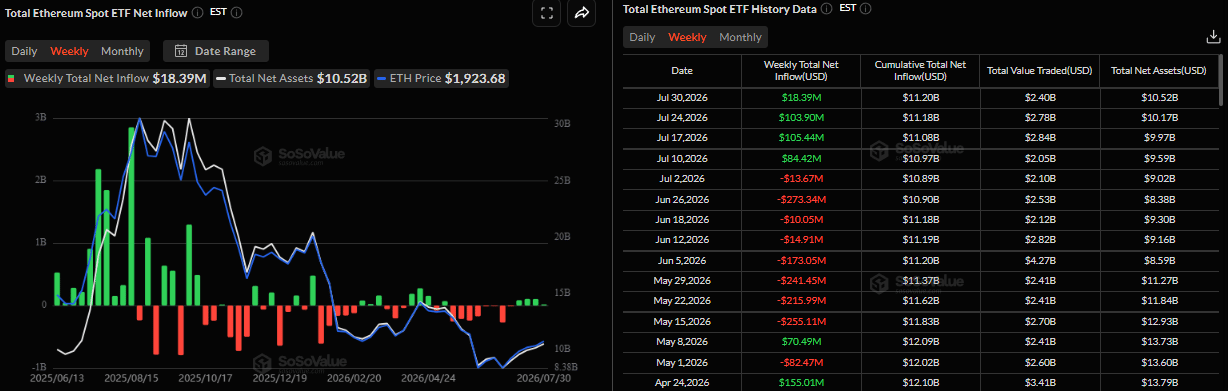
- US-listed spot Ethereum ETFs recorded net inflows through Thursday, pointing to the fourth week of positive flows.
- Escalating US-Iran tensions keep inflation concerns elevated, limiting ETH's upside potential.

Ethereum (ETH) trades sideways between the $1,850 and $1,930 range on Friday as bulls and bears battle for control between key Exponential Moving Averages (EMAs). Institutional demand continues to support ETH, with Exchange Traded Funds (ETFs) recording inflows so far this week, pointing to the fourth week of positive flows. Meanwhile, escalating geopolitical tensions in the Middle East are keeping risk appetite in check, limiting ETH's upside.
Institutional demand supports ETH
Institutional demand shows mild signs of improvement so far this week. SoSoValue data shows that US-listed spot ETH ETFs have recorded an inflow of $18.39 million through Thursday. If Friday shows positive flow, ETH is about to enter its fourth week of steady inflows. These positive flows suggest institutional investors are gradually returning to the market, which could support ETH.
Escalating US-Iran tensions keep inflation risks
Traders continue to price in the possibility of further policy tightening as inflation risks are amplified by rising geopolitical tensions in the Middle East. The ongoing US-Iran conflict has fueled volatility in crude Oil prices, with concerns centered on potential disruptions surrounding crucial shipping chokepoints – the Strait of Hormuz and the Bab el-Mandeb.
In the latest developments, the US military announced it had completed a heavy wave of strikes against Iran, in response to Iranian missile attacks on its forces in the Middle East. Meanwhile, Iran rejected Oman's plan for a 50-50 joint management, which would see Tehran partially control the Strait of Hormuz and collect voluntary fees for using the waterway.
On the other hand, Saudi Arabia is building an international coalition to protect key shipping routes in the Bab al-Mandab Strait, the Red Sea, and the Gulf of Aden from repeated attacks by Yemen's Houthi militias. This raises the risk of a wider regional conflict, keeping the geopolitical risk premium in play and supporting crude oil prices. Investors remain worried that rising energy prices would revive inflationary pressure and force the Federal Reserve (Fed) to adopt a hawkish stance, which in turn would dampen risk appetite and risky assets such as ETH.
Ethereum technical outlook: Fading bearish pressure
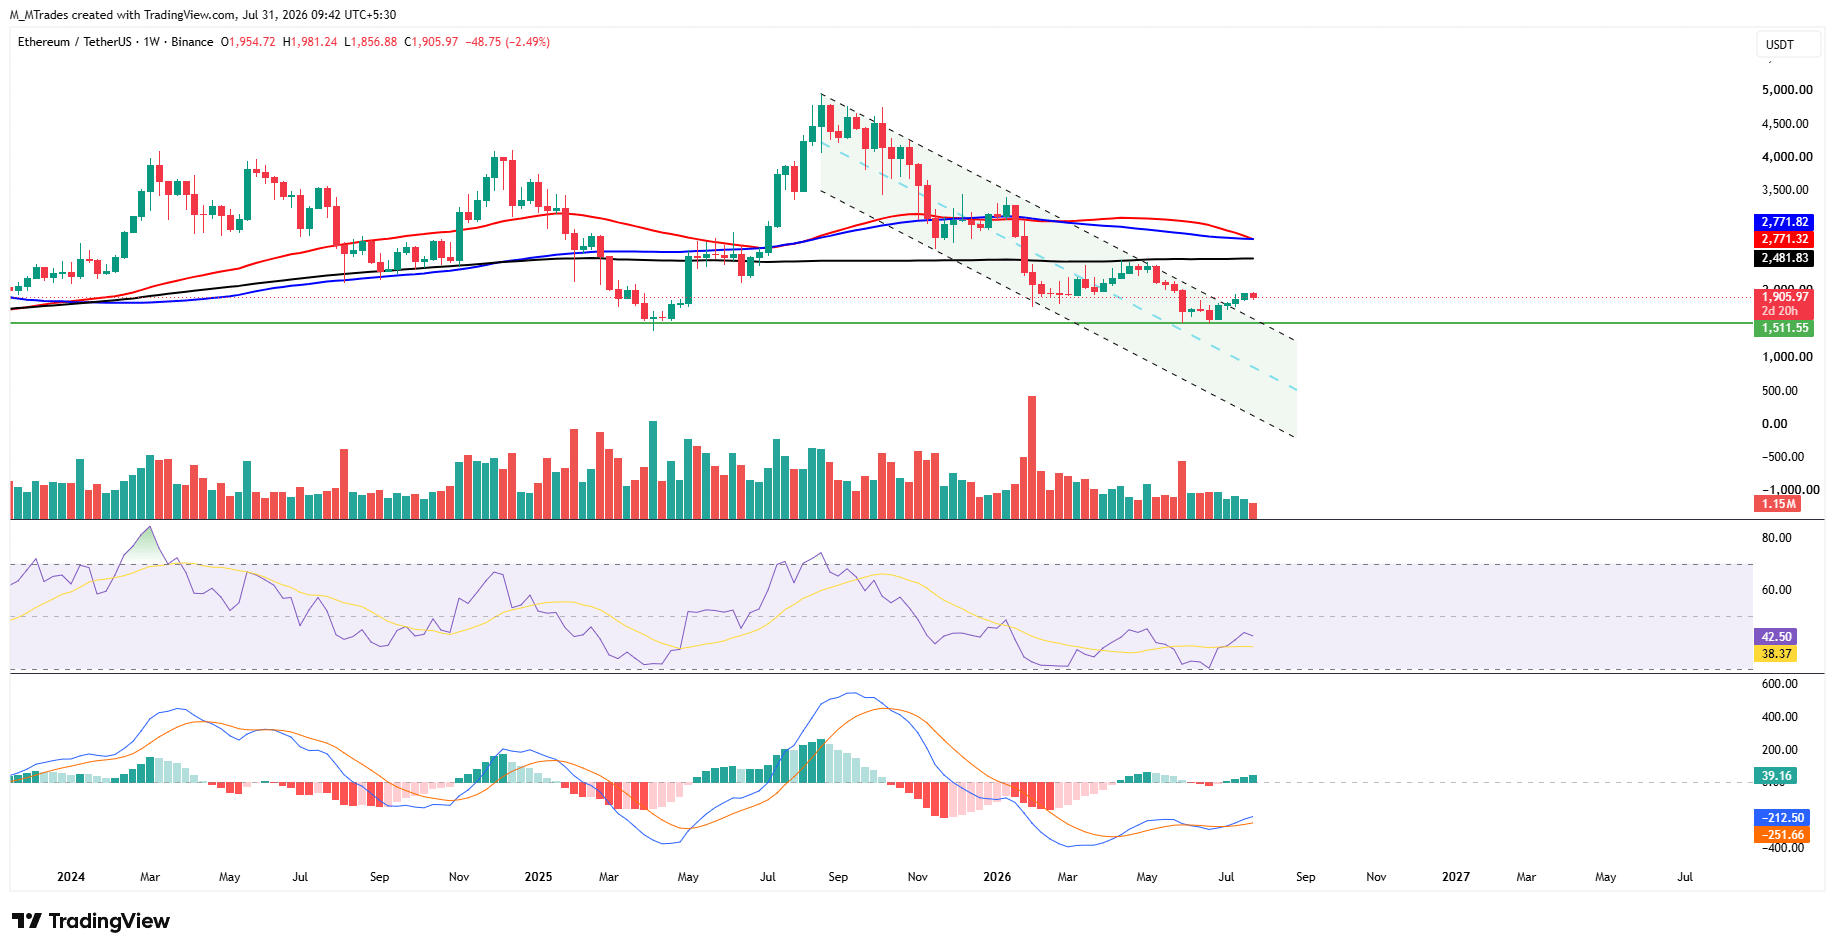
Ethereum price has fallen slightly so far this week, trading around $1,907 at the time of writing on Friday after extending four consecutive weeks of gains since the end of June. ETH price trades below the key Simple Moving Averages (SMAs) on the weekly chart, highlighting a broader bearish trend, but it has broken above a falling parallel channel (drawn by joining multiple highs and lows since mid-August 2025) in mid-July, suggesting that bullish momentum is beginning to emerge.
If ETH continues its recovery, it could extend the advance toward the 200-week SMA at $2,481.
Momentum indicators on the weekly chart show mild signs of easing bearish sentiment. The Relative Strength Index (RSI) is trending higher toward the neutral 50 level, with a reading of 42 on Friday. Meanwhile, the Moving Average Convergence Divergence (MACD) flipped to a bullish crossover in early July, which remains intact, supporting a positive outlook.
However, if ETH corrects, it could extend the decline toward the key support level around $1,511.
On the daily chart, Ethereum is consolidating in a neutral stance between its short- and medium-term moving averages. ETH holds above the 50-day Exponential Moving Average (EMA) at $1,850, suggesting nearby dip-buying interest, but remains capped beneath the 100-day EMA at $1,933, keeping the broader recovery in check.
The RSI hovers around 55, hinting at mild bullish momentum, while the MACD histogram in negative territory suggests lingering downside risk despite the ongoing stabilization.
On the topside, initial resistance is seen at the 100-day EMA near $1,933, followed by the psychological barrier at $2,000, while the 200-day EMA higher at $2,159 forms a more strategic hurdle if bulls regain control.
On the downside, immediate support emerges at the 50-day EMA around $1,850, with a deeper safety net only near the horizontal support zone at $1,385, where a break would significantly deteriorate the medium-term structure.
(The technical analysis of this story was written with the help of an AI tool. Know more.)
Author

Manish Chhetri
FXStreet
Manish Chhetri is a crypto specialist with over four years of experience in the cryptocurrency industry.

















