Dow Jones Industrial Average rallies above 49,500 on Caterpillar earnings boost
- DJIA jumped roughly 1.5% as a strong Caterpillar print lifted industrial names.
- US Q1 Gross Domestic Product came in below estimates at 2% annualized, while Core PCE held steady at 3.2% YoY.
- Initial Jobless Claims dropped sharply to 189K, well below the 215K consensus.
- Meta and Microsoft weighed on the Nasdaq and S&P 500 on rising AI capex concerns.

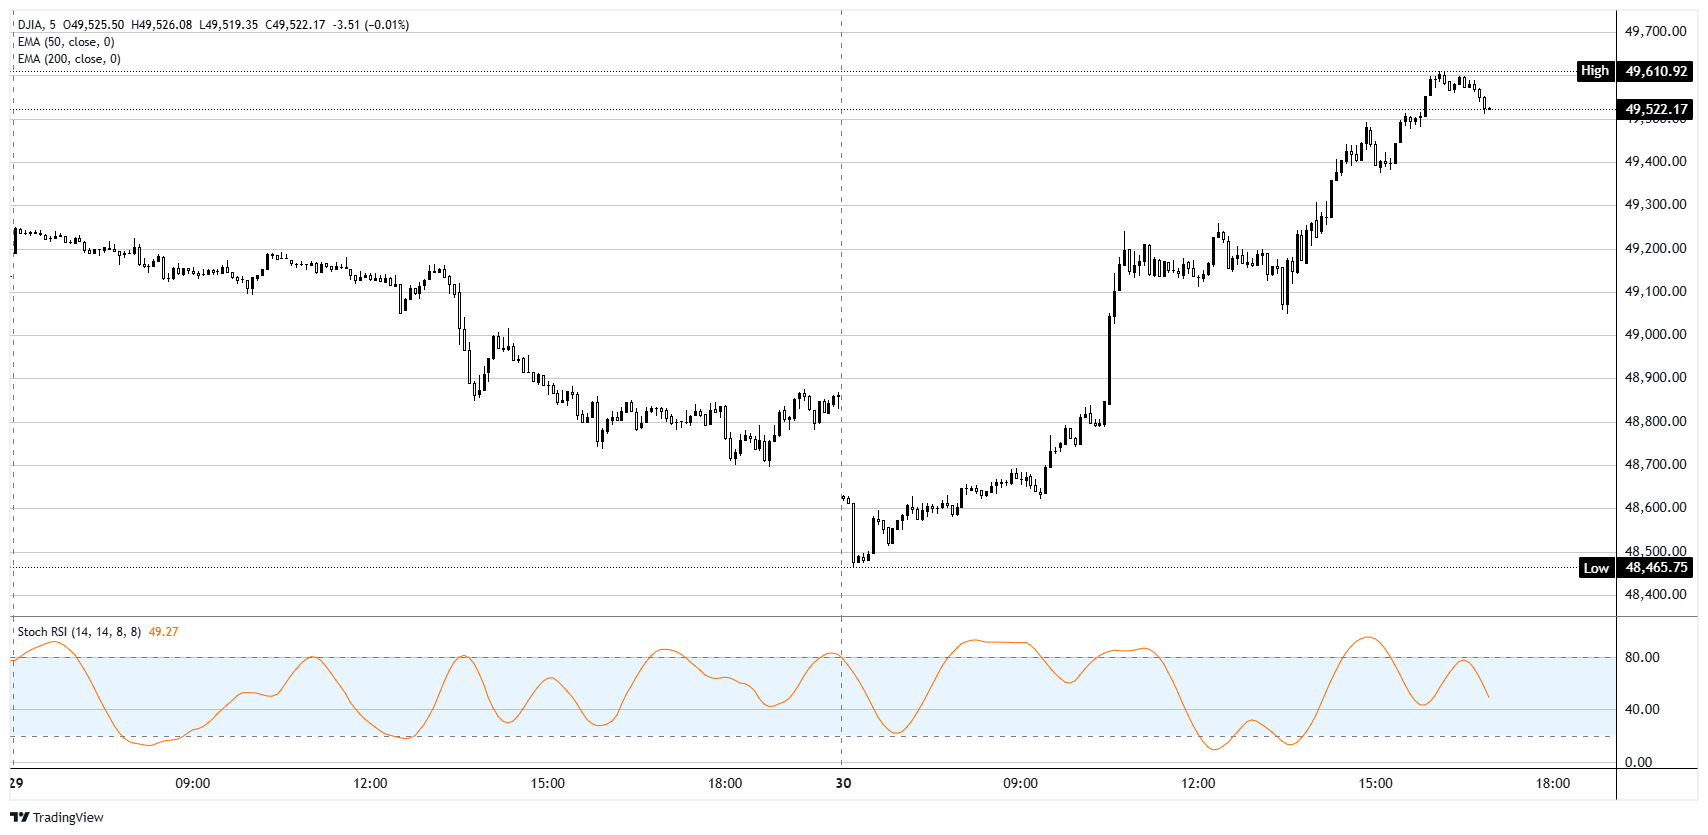
The Dow Jones Industrial Average climbed sharply on Thursday, adding about 730 points, or 1.5%, after rallying from an overnight low below 48,500 to a session high just above 49,600. The S&P 500 added roughly 0.5%, while the tech-heavy Nasdaq Composite eked out a 0.2% gain as mega-cap tech weakness capped broader index performance. The split tape underscored a clear divide between old-economy industrials and AI-exposed technology names.
Caterpillar lifts the blue chips
Caterpillar (CAT) shares jumped about 10% after the heavy machinery maker delivered a stronger-than-expected quarterly print and raised its annual revenue outlook. The industrial bellwether's results offered a measure of reassurance about global demand and were the single largest contributor to the Dow's outsized gain. Several other industrial names tracked higher in sympathy, helping the index outpace its peers by a wide margin.
Mega-cap tech weighs on the Nasdaq
Meta (META) tumbled roughly 9% as the company lifted its capital expenditure guidance and posted softer user growth, fanning concerns that AI spending is running ahead of monetization. Microsoft (MSFT) shed about 5% after flagging that capex would reach $190 billion this year, partly driven by elevated memory costs. The two names alone shaved meaningful points off both the Nasdaq and S&P 500, leaving the broader tech complex on the back foot.
GDP misses while inflation holds firm
Q1 Gross Domestic Product (GDP) printed at 2% annualized in the 12:30 GMT release, below the 2.3% consensus though up from 0.5% in Q4 2025. Personal Consumption Expenditures (PCE) Price Index data for March came in line with expectations, with headline PCE at 3.5% YoY and Core PCE at 3.2% YoY, both slightly hotter than the prior month. Initial Jobless Claims surprised to the downside at 189K, well below the 215K consensus and pointing to a still-resilient labor market. The Employment Cost Index (ECI) ticked up to 0.9% in Q1, while Chicago Purchasing Managers Index (PMI) slipped to 49.2 in April, dropping back into contraction.
Oil reverses lower on profit-taking
West Texas Intermediate (WTI) Oil futures fell about 2% to trade above $104 a barrel, while Brent crude shed roughly 3% to trade above $114. The pullback followed a sharp Wednesday rally driven by reports that the White House had instructed officials to prepare for an extended blockade of Iran. Energy traders remain on alert for further escalation in the Strait of Hormuz, though Thursday's session leaned toward profit-taking after the prior day's surge.
Fed aftermath colours rate-cut bets
Markets continued to digest Wednesday's Federal Reserve (Fed) decision to hold rates steady at 3.5% to 3.75%, with the 8-4 vote marking the largest dissent since 1992. With incoming Chair Kevin Warsh in the dovish minority, traders are recalibrating expectations for further cuts later this year.
Dow Jones 5-minute chart
Dow Jones FAQs
The Dow Jones Industrial Average, one of the oldest stock market indices in the world, is compiled of the 30 most traded stocks in the US. The index is price-weighted rather than weighted by capitalization. It is calculated by summing the prices of the constituent stocks and dividing them by a factor, currently 0.152. The index was founded by Charles Dow, who also founded the Wall Street Journal. In later years it has been criticized for not being broadly representative enough because it only tracks 30 conglomerates, unlike broader indices such as the S&P 500.
Many different factors drive the Dow Jones Industrial Average (DJIA). The aggregate performance of the component companies revealed in quarterly company earnings reports is the main one. US and global macroeconomic data also contributes as it impacts on investor sentiment. The level of interest rates, set by the Federal Reserve (Fed), also influences the DJIA as it affects the cost of credit, on which many corporations are heavily reliant. Therefore, inflation can be a major driver as well as other metrics which impact the Fed decisions.
Dow Theory is a method for identifying the primary trend of the stock market developed by Charles Dow. A key step is to compare the direction of the Dow Jones Industrial Average (DJIA) and the Dow Jones Transportation Average (DJTA) and only follow trends where both are moving in the same direction. Volume is a confirmatory criteria. The theory uses elements of peak and trough analysis. Dow’s theory posits three trend phases: accumulation, when smart money starts buying or selling; public participation, when the wider public joins in; and distribution, when the smart money exits.
There are a number of ways to trade the DJIA. One is to use ETFs which allow investors to trade the DJIA as a single security, rather than having to buy shares in all 30 constituent companies. A leading example is the SPDR Dow Jones Industrial Average ETF (DIA). DJIA futures contracts enable traders to speculate on the future value of the index and Options provide the right, but not the obligation, to buy or sell the index at a predetermined price in the future. Mutual funds enable investors to buy a share of a diversified portfolio of DJIA stocks thus providing exposure to the overall index.
Author

Joshua Gibson
FXStreet
Joshua joins the FXStreet team as an Economics and Finance double major from Vancouver Island University with twelve years' experience as an independent trader focusing on technical analysis.