Dow Jones Industrial Average is green for all the wrong reasons
- The Dow closed higher Monday even as the broader market sold off.
- The green close reflects a rotation out of mega-cap technology, not genuine strength.
- Thursday's core PCE release is the week's decisive catalyst against a hawkish Fed backdrop.

The Dow Jones Industrial Average (DJIA) booked a green close on Monday, adding roughly 167 points, or 0.3%, on a session that was anything but bullish underneath. That gain reads as strength until you notice the S&P 500 slipped 0.3% and the Nasdaq Composite shed 1.1%, which means the index did not lead the tape so much as outlast it. The DJIA settled near 51,750 after a volatile run; the green print owes far more to what it does not hold than to anything it does.
Borrowed strength from a tech exodus
The real story on Monday was capital fleeing the mega-cap technology that has carried this market for two years. Alphabet dropped 6% on fears that artificial intelligence talent is heading for the exits, with Amazon and Meta off 4% and 3% and the newly listed SpaceX sliding another 8% in its third straight decline. Holding far less of that growth complex than the Nasdaq, the DJIA became the passive beneficiary of the rotation into value rather than its engine. Microsoft, one of the Dow's own thirty, fell 2% and still could not drag the index red, a measure of how indiscriminate the bid for everything-but-tech really was.
Falling Crude Oil cuts both ways
Crude Oil prices turned lower after mediators Qatar and Pakistan said Washington and Tehran had agreed on a roadmap toward a final deal within 60 days; the slide deepened once the Treasury cleared Iranian Crude Oil sales for the same window, taking Brent down more than 3% toward $77 and WTI off over 2% to near $74. Cheaper energy flatters the Dow's industrial and transport names, though a roadmap is not a signed deal. Implementation talks have already slipped amid renewed fighting in Lebanon; treating a 60-day framework as settled peace is the kind of optimism this tape has burned before.
A high that would not stick
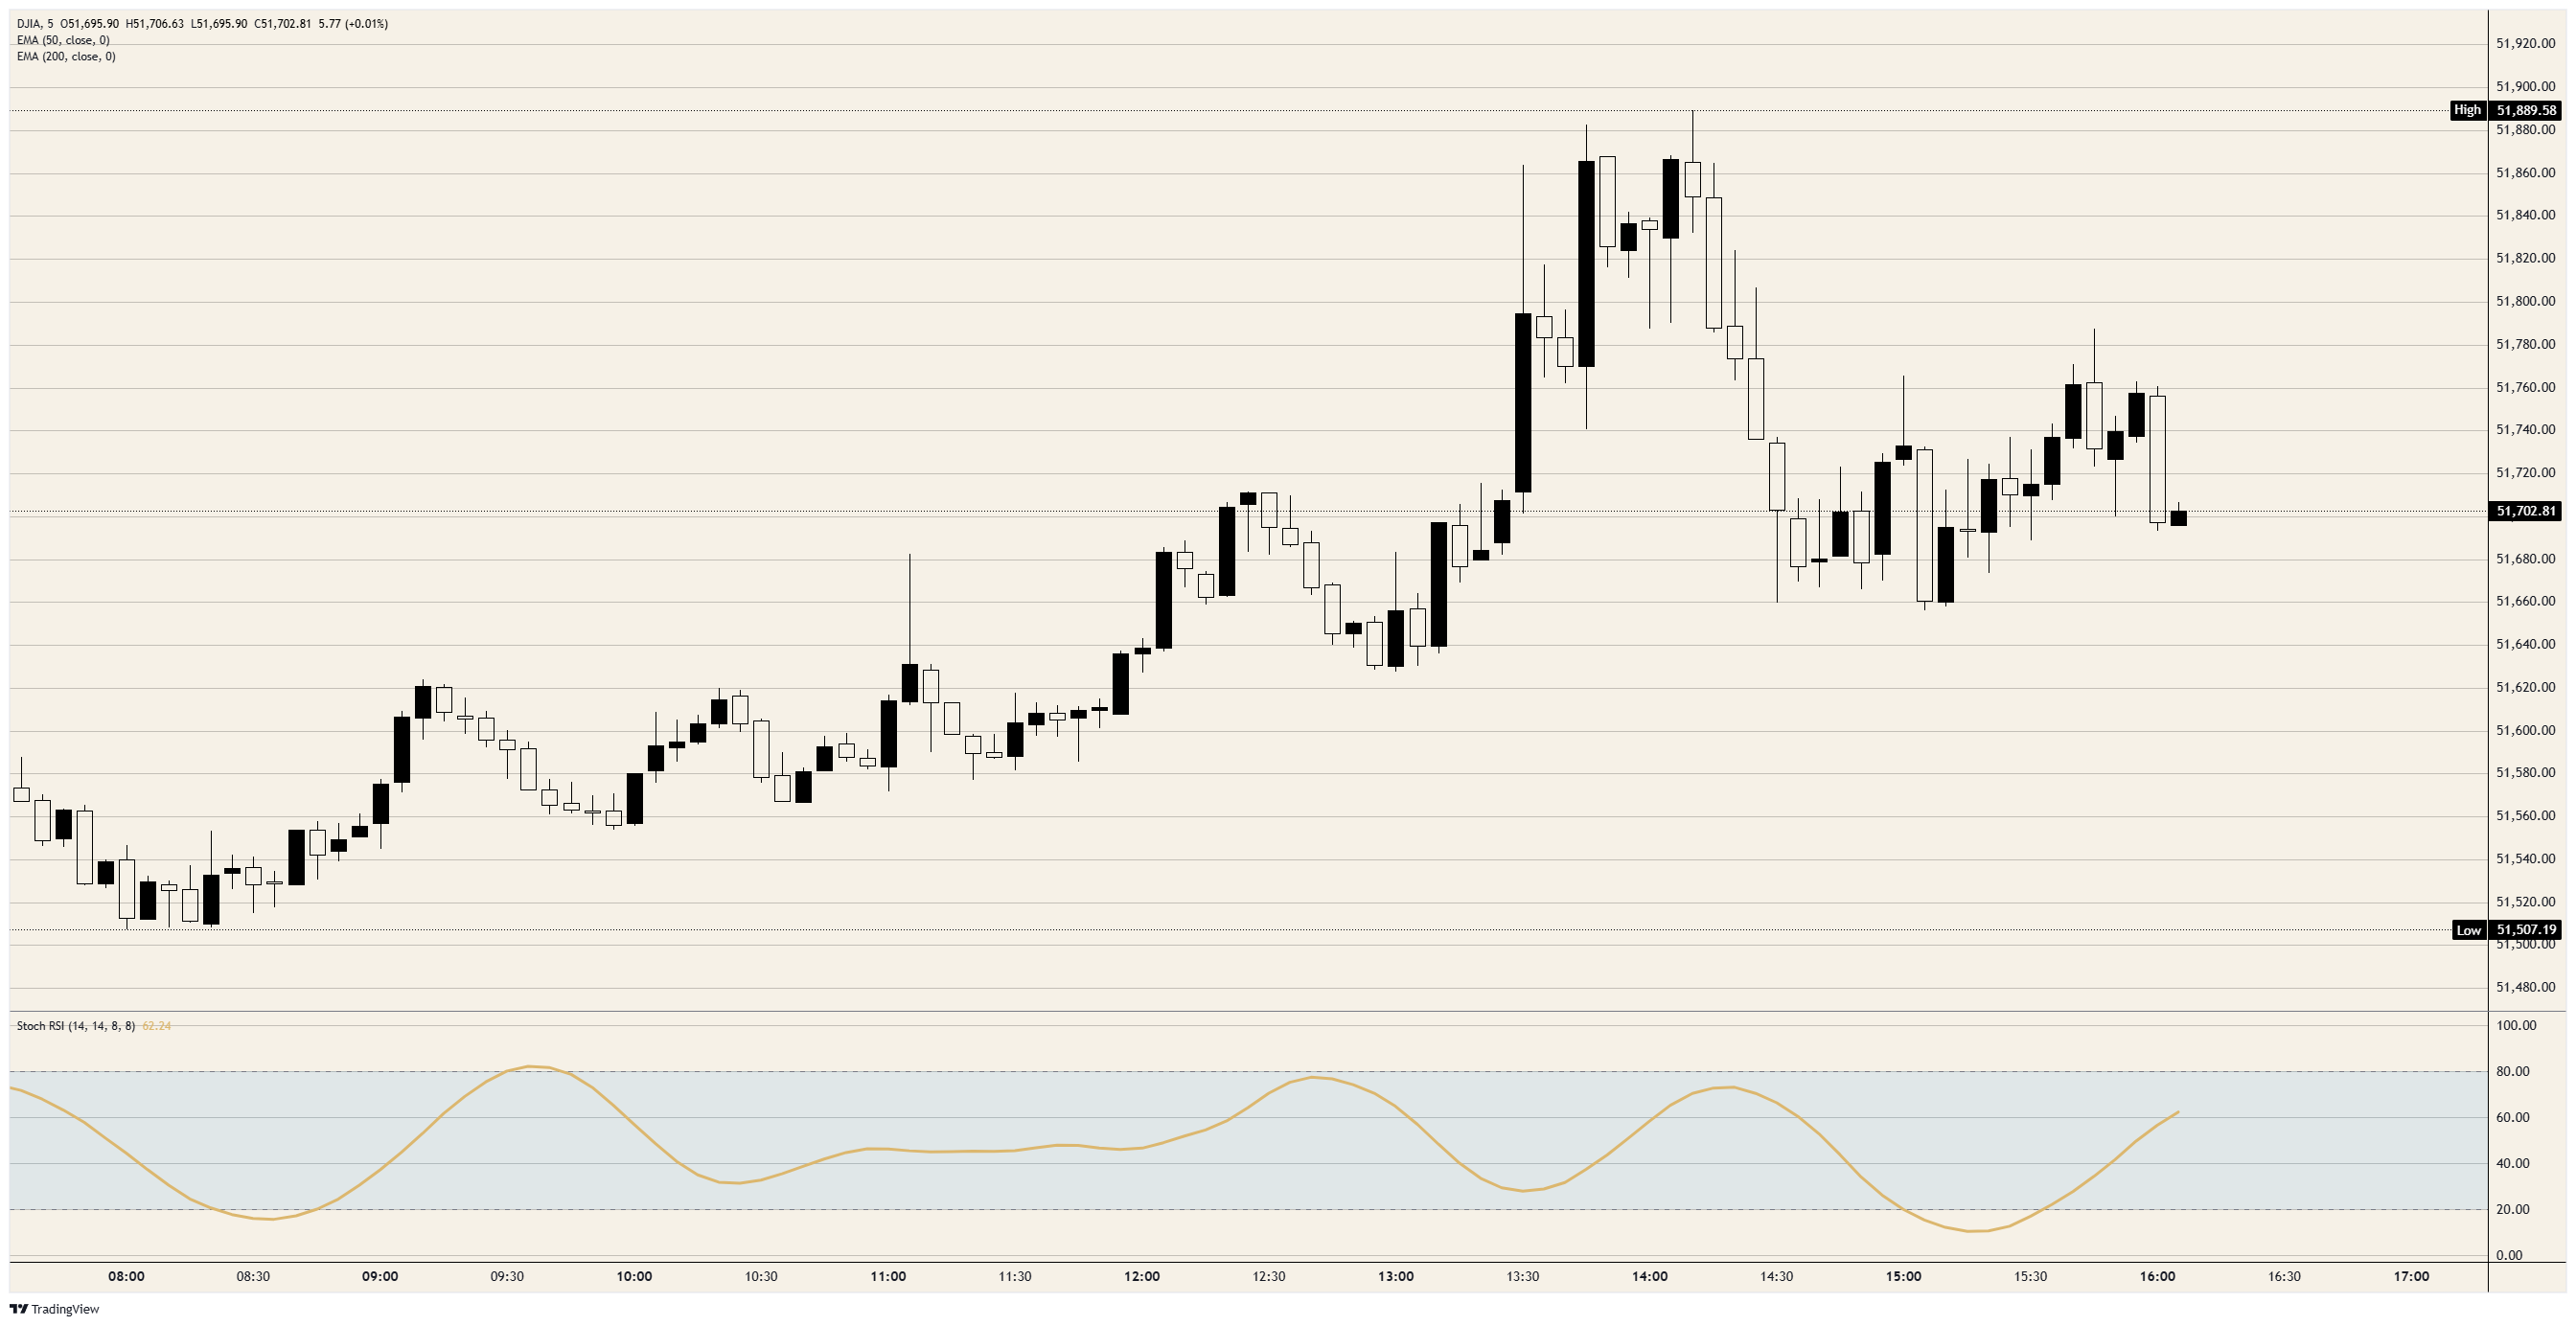
The price action backs that skepticism, with futures dipping to the session low near 51,500 during the overnight and premarket hours before grinding higher through the cash session to a fresh high close to 51,900 and then surrendering roughly 140 points to settle near 51,750. A push to a new high that fades almost immediately is not the signature of a market that trusts its own rally. The Stochastic Relative Strength Index (Stoch RSI) finished around 49.5, mid-range with no momentum extreme in either direction, the reading of a tape that is churning rather than breaking out.
All roads lead to Thursday's PCE
The week's defining event lands Thursday at 12:30 GMT, when the May reading of the Personal Consumption Expenditures Price Index (PCE) arrives alongside the third estimate of first-quarter Gross Domestic Product (GDP). Core PCE is expected to tick up to 3.4% YoY from 3.3%, with the monthly pace seen near 0.3% against 0.2% prior; the headline gauge is pencilled in at 4% YoY. That matters because last week's hawkish Federal Open Market Committee (FOMC) decision pulled rate-hike expectations forward to as soon as October, leaving the Federal Reserve (Fed) hunting for any excuse to tighten. A hot inflation print would harden that pricing; rotation only shelters the Dow until the entire tape reprices on rates.
Resistance: The session high near 51,900 is the immediate ceiling, with the round 52,000 mark just above. Rallies into that band look like selling opportunities while the Fed leans hawkish; bulls need a close above 51,900 before any breakout deserves trust.
Support: Initial support sits near 51,650, the intraday shelf the index leaned on through the afternoon, with the session low near 51,500 the line that matters beneath it. A close below 51,500 would confirm the rotation bid has run out of road.
Bias: The directional lean is lower into Thursday, with Monday's green close best read as a rotation artifact rather than evidence of underlying demand. The spike-and-fade tape argues for fading strength rather than chasing it; the play is to sell rallies toward 51,900 with a downside target near 51,500. A hot core PCE print is the catalyst most likely to crack that floor.
Dow Jones Industrial Average 5-minute chart
Dow Jones FAQs
The Dow Jones Industrial Average, one of the oldest stock market indices in the world, is compiled of the 30 most traded stocks in the US. The index is price-weighted rather than weighted by capitalization. It is calculated by summing the prices of the constituent stocks and dividing them by a factor, currently 0.152. The index was founded by Charles Dow, who also founded the Wall Street Journal. In later years it has been criticized for not being broadly representative enough because it only tracks 30 conglomerates, unlike broader indices such as the S&P 500.
Many different factors drive the Dow Jones Industrial Average (DJIA). The aggregate performance of the component companies revealed in quarterly company earnings reports is the main one. US and global macroeconomic data also contributes as it impacts on investor sentiment. The level of interest rates, set by the Federal Reserve (Fed), also influences the DJIA as it affects the cost of credit, on which many corporations are heavily reliant. Therefore, inflation can be a major driver as well as other metrics which impact the Fed decisions.
Dow Theory is a method for identifying the primary trend of the stock market developed by Charles Dow. A key step is to compare the direction of the Dow Jones Industrial Average (DJIA) and the Dow Jones Transportation Average (DJTA) and only follow trends where both are moving in the same direction. Volume is a confirmatory criteria. The theory uses elements of peak and trough analysis. Dow’s theory posits three trend phases: accumulation, when smart money starts buying or selling; public participation, when the wider public joins in; and distribution, when the smart money exits.
There are a number of ways to trade the DJIA. One is to use ETFs which allow investors to trade the DJIA as a single security, rather than having to buy shares in all 30 constituent companies. A leading example is the SPDR Dow Jones Industrial Average ETF (DIA). DJIA futures contracts enable traders to speculate on the future value of the index and Options provide the right, but not the obligation, to buy or sell the index at a predetermined price in the future. Mutual funds enable investors to buy a share of a diversified portfolio of DJIA stocks thus providing exposure to the overall index.
Author

Joshua Gibson
FXStreet
Joshua joins the FXStreet team as an Economics and Finance double major from Vancouver Island University with twelve years' experience as an independent trader focusing on technical analysis.