Crude Oil takes back the reopening it bought on Tuesday
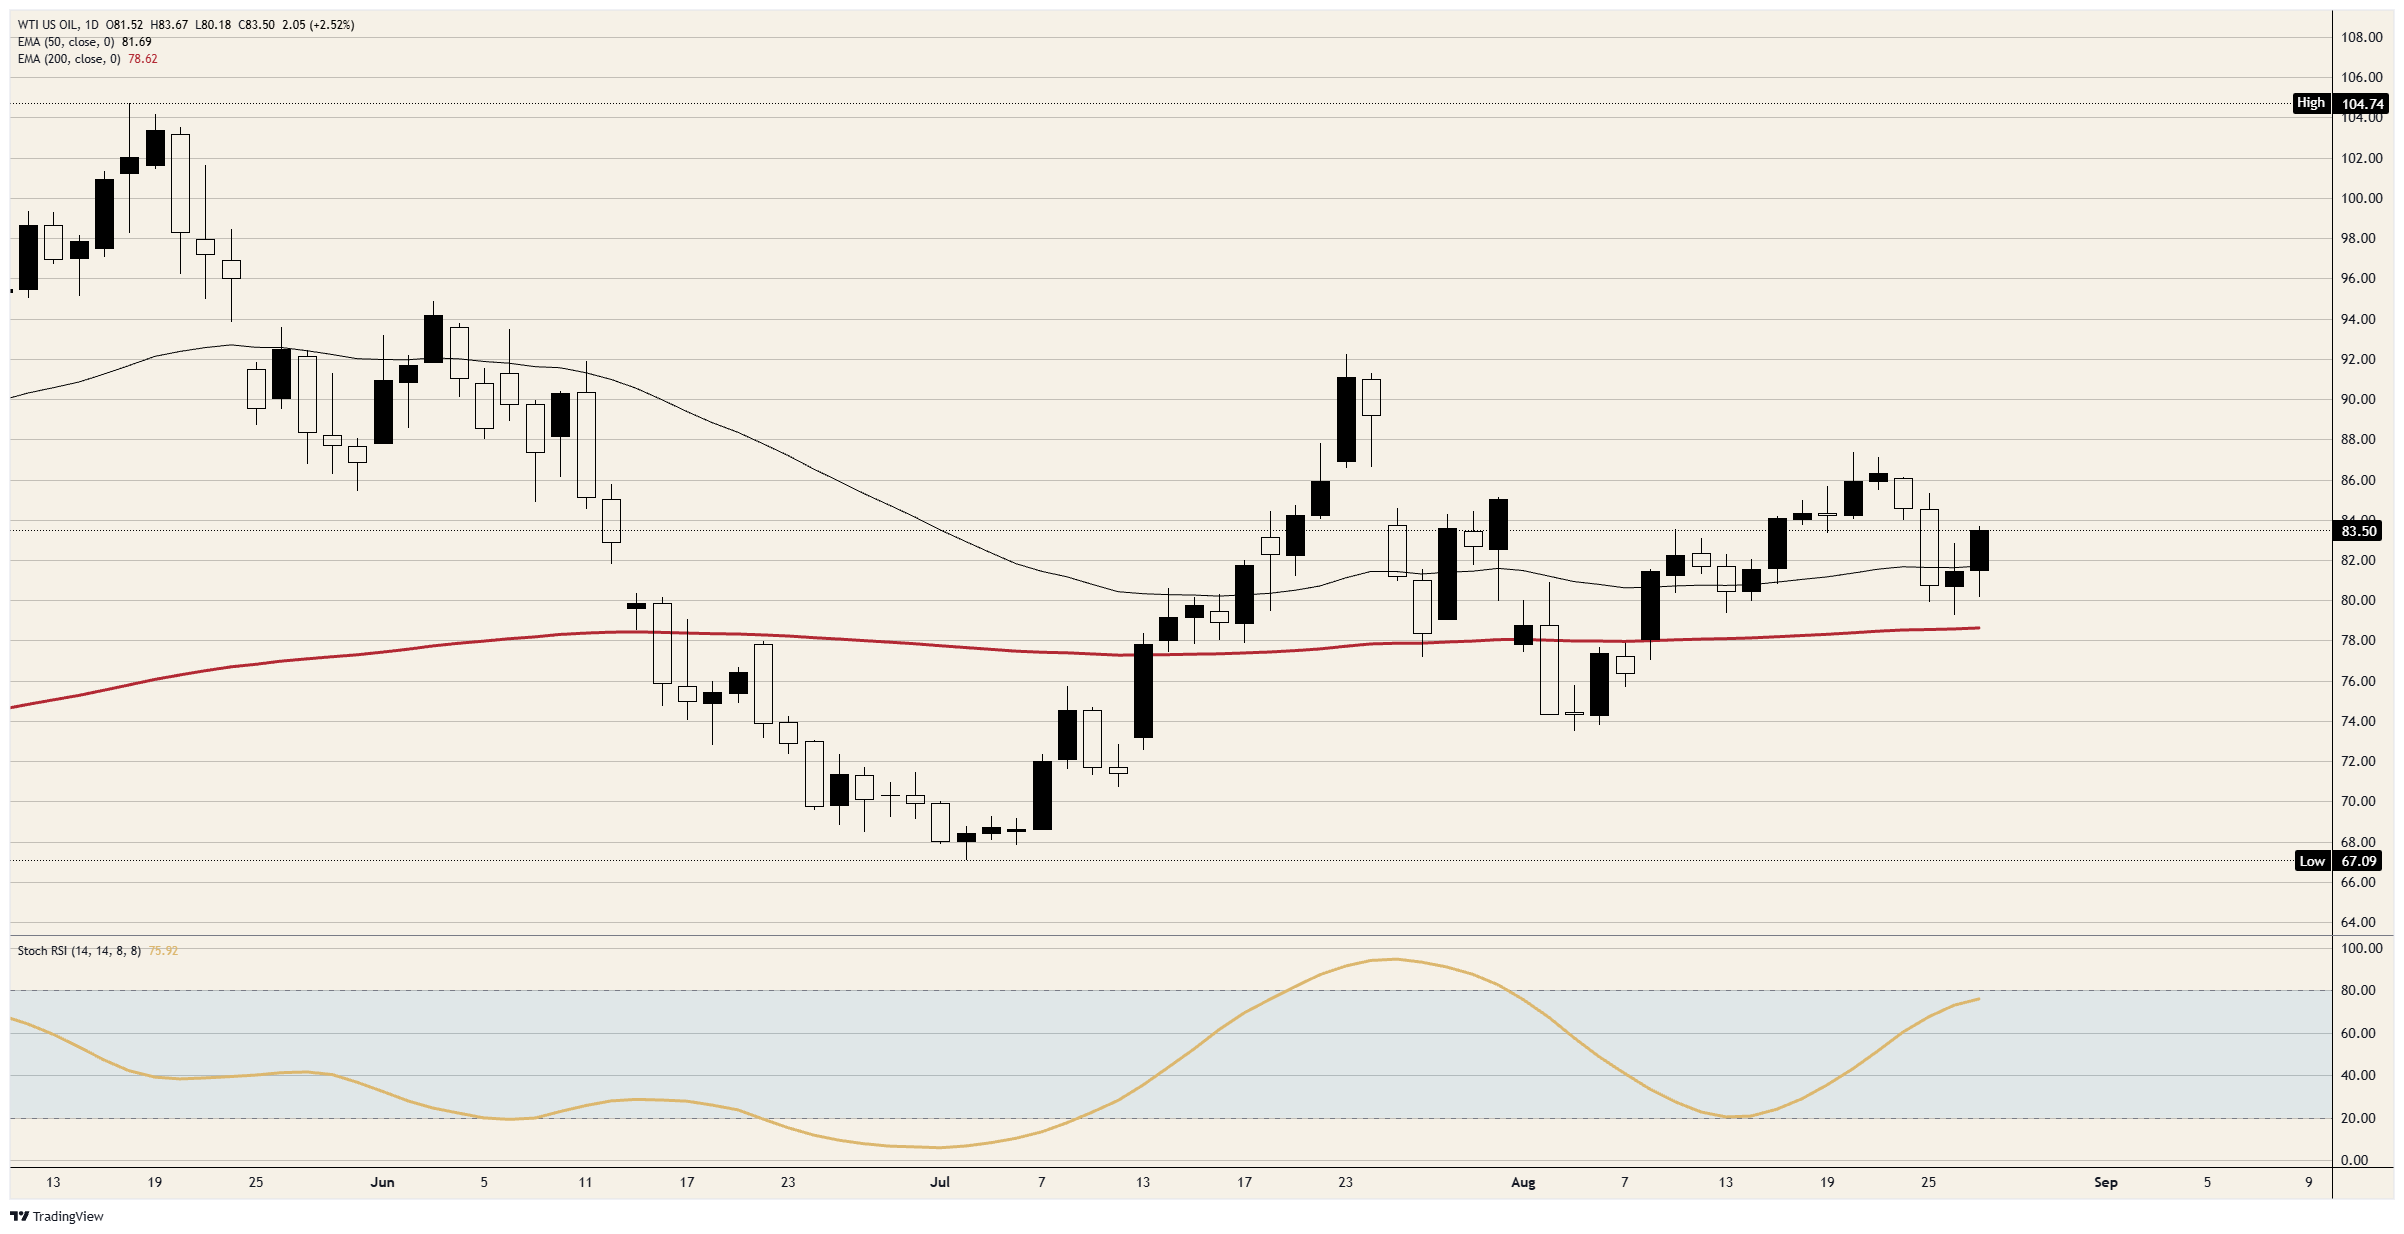
- WTI trades near $83.50, up 2.52% and more than $3.00 off its session low.
- Revolutionary Guard ties any reopening to the deal Washington has dropped.
- Blockade in force, no talks scheduled, mediators left without a framework.

Crude Oil trades near $83.50 on Thursday, ahead 2.52% and more than $3.00 above a session low just above $80.00 printed at 07:00 GMT. The final leg is the loud one, better than a dollar inside the twenty minutes before 18:00 GMT, carrying the barrel through its own earlier ceiling in the $82.50 area and into a high just short of $84.00.
Both capitals now quote the same dead document
The June framework signed at Versailles is the only reopening mechanism on the table, and Thursday's reporting has each side refusing it on the other's reading. Washington has told mediators it will not go back to the memorandum, judging it soft, and has turned instead to economic pressure under a named campaign to cut the regime's remaining financial lifelines. Tehran's Revolutionary Guard said Wednesday the Strait of Hormuz stays shut until the United States resumes implementing that same document, export waivers and blockade relief included.
Iranian conservatives read the agreement's fifth paragraph as their licence to set the terms of any opening, which is exactly the reading Washington will not accept. Pakistan's army chief left Tehran this week with nothing, Oman's foreign minister followed on transit lanes and drew a rebuke from Washington for conceding too much, and Qatar's prime minister arrived Thursday to discuss heading off escalation rather than a deal.
What the barrel is pricing
Three sessions of selling into Tuesday's corridor headline priced a reopening that never carried a signature, and Thursday takes roughly half of it back. That makes it another de-escalation this tape has bought and returned since April, on the same pattern each time. The physical constraint has not moved through any of them, with a tanker struck off Oman on Tuesday and the blockade stated to be in full force, and the two governments reading one paragraph in opposite directions are the pair that control the lanes.
Levels
Resistance: The session high just short of $84.00 is the first mark, with the August peak just above $86.00 above it and the July spike near the $92.00 handle beyond that.
Support: The 50-day Exponential Moving Average (EMA) near $81.50 is the line that matters, the session low just above $80.00 beneath it, and the 200-day near $78.50 under that.
Bias: Bullish above $81.50. The daily Stochastic Relative Strength Index (Stoch RSI) near 76 is climbing into the upper band with price back above both averages, and a deadlock without a framework is not a condition that sells barrels. Invalidation on a daily close beneath the $81.00 handle.
WTI daily chart
WTI Oil FAQs
WTI Oil is a type of Crude Oil sold on international markets. The WTI stands for West Texas Intermediate, one of three major types including Brent and Dubai Crude. WTI is also referred to as “light” and “sweet” because of its relatively low gravity and sulfur content respectively. It is considered a high quality Oil that is easily refined. It is sourced in the United States and distributed via the Cushing hub, which is considered “The Pipeline Crossroads of the World”. It is a benchmark for the Oil market and WTI price is frequently quoted in the media.
Like all assets, supply and demand are the key drivers of WTI Oil price. As such, global growth can be a driver of increased demand and vice versa for weak global growth. Political instability, wars, and sanctions can disrupt supply and impact prices. The decisions of OPEC, a group of major Oil-producing countries, is another key driver of price. The value of the US Dollar influences the price of WTI Crude Oil, since Oil is predominantly traded in US Dollars, thus a weaker US Dollar can make Oil more affordable and vice versa.
The weekly Oil inventory reports published by the American Petroleum Institute (API) and the Energy Information Agency (EIA) impact the price of WTI Oil. Changes in inventories reflect fluctuating supply and demand. If the data shows a drop in inventories it can indicate increased demand, pushing up Oil price. Higher inventories can reflect increased supply, pushing down prices. API’s report is published every Tuesday and EIA’s the day after. Their results are usually similar, falling within 1% of each other 75% of the time. The EIA data is considered more reliable, since it is a government agency.
OPEC (Organization of the Petroleum Exporting Countries) is a group of 12 Oil-producing nations who collectively decide production quotas for member countries at twice-yearly meetings. Their decisions often impact WTI Oil prices. When OPEC decides to lower quotas, it can tighten supply, pushing up Oil prices. When OPEC increases production, it has the opposite effect. OPEC+ refers to an expanded group that includes ten extra non-OPEC members, the most notable of which is Russia.
Author

Joshua Gibson
FXStreet
Joshua joins the FXStreet team as an Economics and Finance double major from Vancouver Island University with twelve years' experience as an independent trader focusing on technical analysis.