GBP/JPY Price Forecast: Weak momentum keeps sellers in control
- GBP/JPY recovers early losses as BoE interest rate hike expectations lend support to the British Pound.
- The 50-day SMA offers support, although the broader technical setup remains bearish.
- GBP/JPY faces initial resistance at the 21-day SMA near 211.30.


GBP/JPY erases its intraday losses on Tuesday, trading near 210.17 after falling to 209.57, its lowest level since October 28. Bets on further Bank of England (BoE) rate hikes help the British Pound (GBP) recover against the Japanese Yen (JPY), even as a sell-off in tech stocks boosts demand for the safe-haven Yen against most other major currencies.
Traders now turn to Wednesday’s UK inflation data, which could shift BoE rate hike expectations and set the next direction for GBP/JPY.
Technical analysis
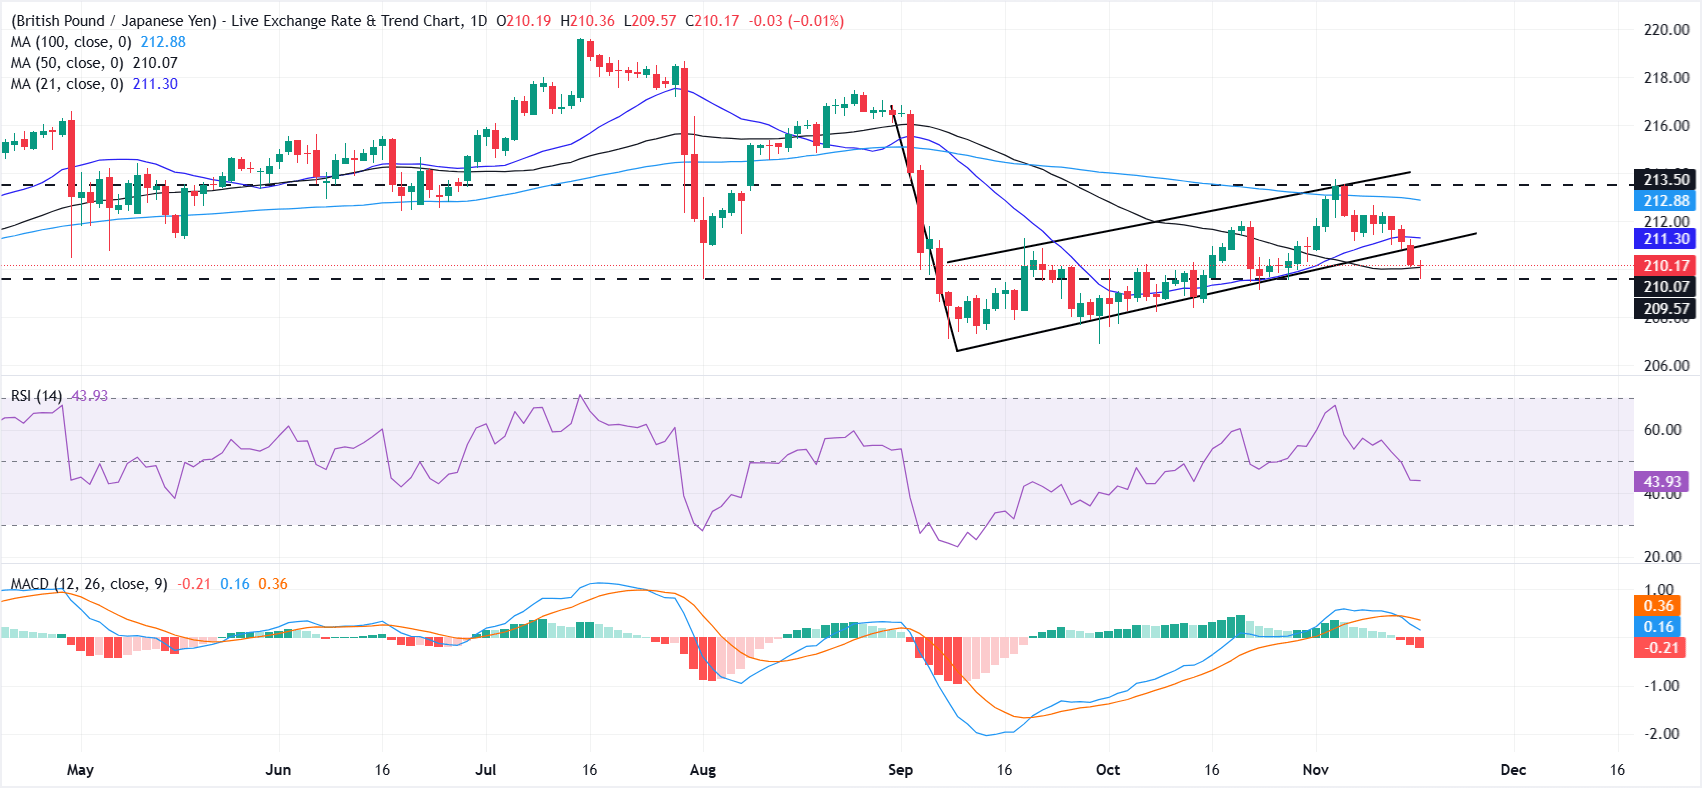
The near-term outlook for GBP/JPY remains bearish after the cross slipped below the lower boundary of a bear flag on the daily chart. The 50-day Simple Moving Average (SMA) at 210.07 sits just below that boundary and has helped absorb some of the selling pressure. The cross remains below the 21-day SMA at 211.30 and the 100-day SMA at 212.88.
Momentum indicators reinforce this soft bias, with the Relative Strength Index (RSI) stuck near a neutral 44 while the Moving Average Convergence Divergence (MACD) has turned negative.
A daily close below the 50-day SMA would bring the intraday low of 209.57 back into focus. A break below that level could lead to a deeper decline towards 207.00.
On the upside, initial resistance lies at the 21-day SMA at 211.31, near the bear flag’s lower boundary, followed by the 100-day SMA at 212.88 and horizontal resistance at 213.50.
(The technical analysis of this story was written with the help of an AI tool. Know more.)
Japanese Yen Price Today
The table below shows the percentage change of Japanese Yen (JPY) against listed major currencies today. Japanese Yen was the strongest against the Euro.
| USD | EUR | GBP | JPY | CAD | AUD | NZD | CHF | |
|---|---|---|---|---|---|---|---|---|
| USD | 0.05% | -0.09% | -0.11% | -0.08% | -0.02% | -0.02% | -0.03% | |
| EUR | -0.05% | -0.14% | -0.16% | -0.13% | -0.08% | -0.07% | -0.08% | |
| GBP | 0.09% | 0.14% | 0.00% | 0.01% | 0.07% | 0.07% | 0.06% | |
| JPY | 0.11% | 0.16% | 0.00% | 0.04% | 0.09% | 0.09% | 0.09% | |
| CAD | 0.08% | 0.13% | -0.01% | -0.04% | 0.05% | 0.05% | 0.05% | |
| AUD | 0.02% | 0.08% | -0.07% | -0.09% | -0.05% | 0.00% | -0.00% | |
| NZD | 0.02% | 0.07% | -0.07% | -0.09% | -0.05% | -0.01% | 0.00% | |
| CHF | 0.03% | 0.08% | -0.06% | -0.09% | -0.05% | 0.00% | -0.01% |
The heat map shows percentage changes of major currencies against each other. The base currency is picked from the left column, while the quote currency is picked from the top row. For example, if you pick the Japanese Yen from the left column and move along the horizontal line to the US Dollar, the percentage change displayed in the box will represent JPY (base)/USD (quote).
Author
Vishal Chaturvedi
FXStreet
I am a macro-focused research analyst with over four years of experience covering forex and commodities market. I enjoy breaking down complex economic trends and turning them into clear, actionable insights that help traders stay ahead of the curve.