AUD/USD Price Forecast: Advances to 0.7170 as bulls await range breakout on softer USD
- AUD/USD attracts some dip-buyers on Monday amid a modest US Dollar weakness.
- The RBA’s hawkish stance counters US-Iran tensions and offers support to the Aussie.
- The technical setup favors bulls as the market focus shifts to the key FOMC meeting.

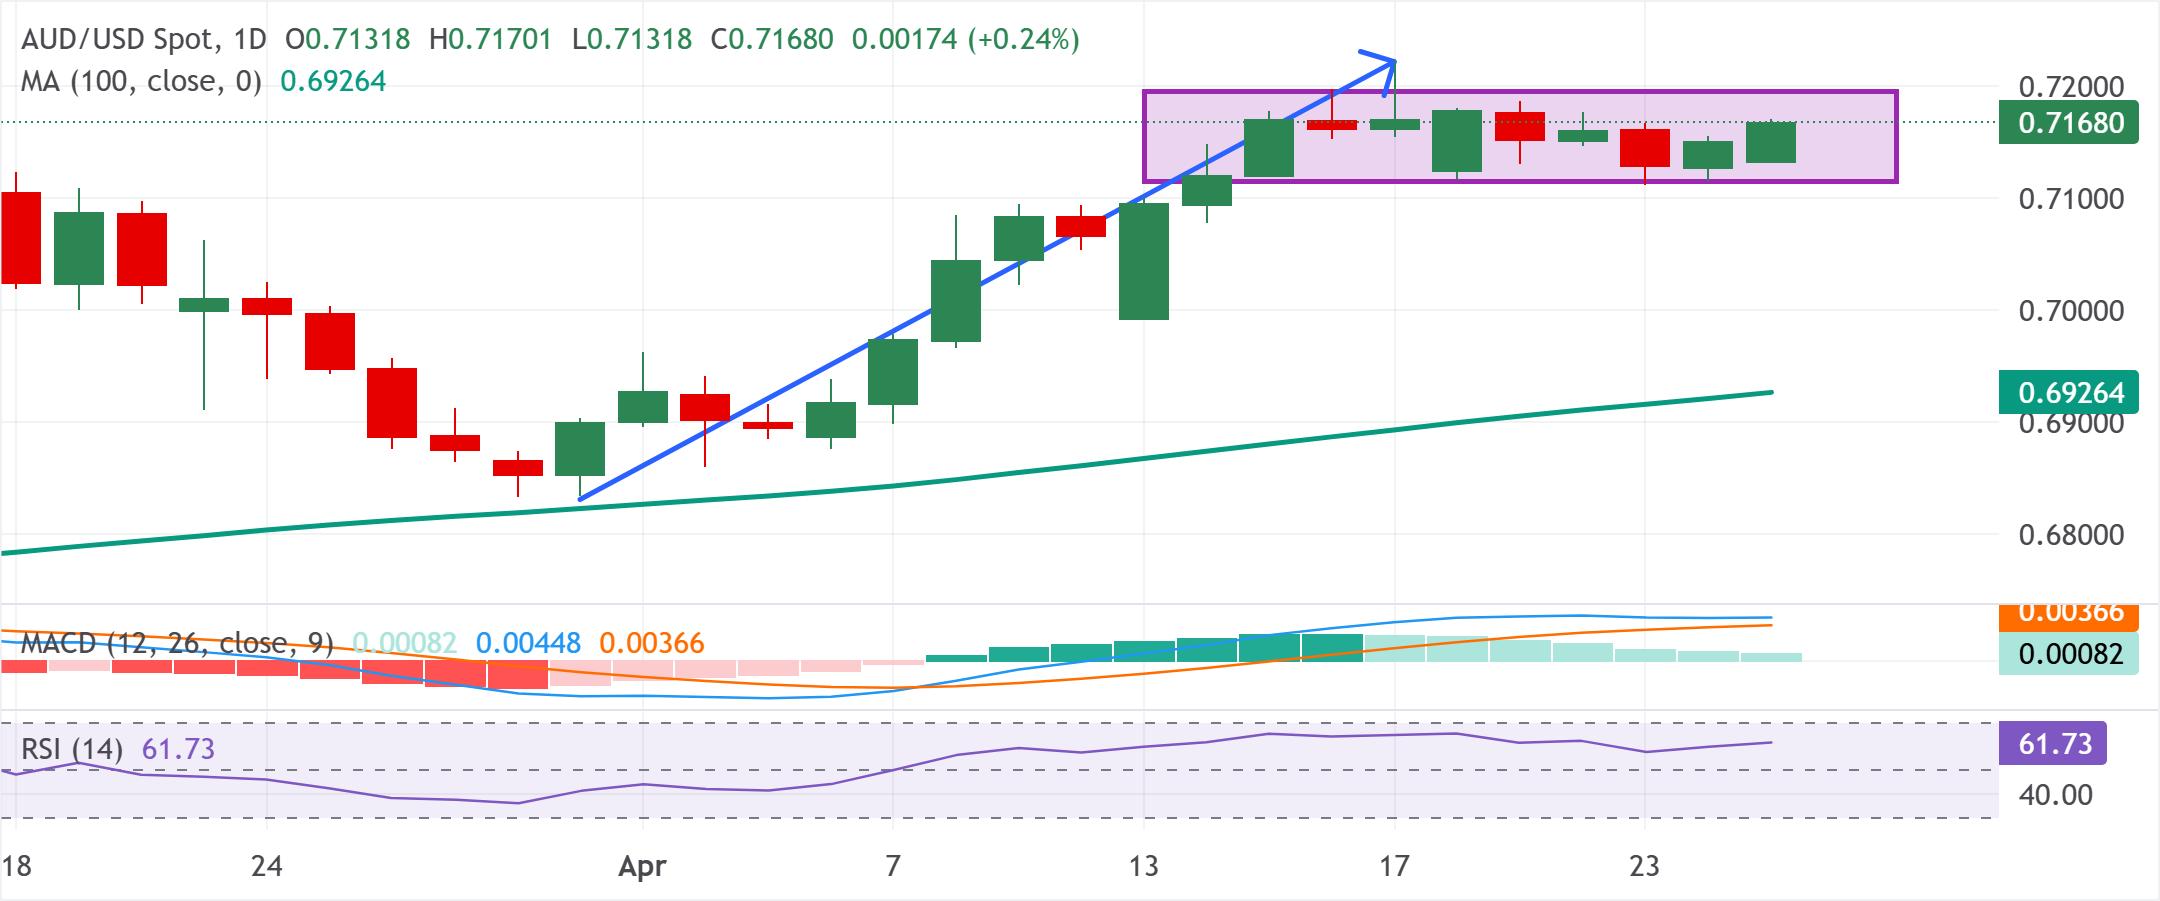
The AUD/USD pair turns positive for the second consecutive day following a modest dip on Monday and climbs to a three-day high, around the 0.7170 region during the Asian session. Spot prices, however, remain confined within a familiar range that has been held over the past two weeks or so, warranting some caution for bullish traders.
Despite stalled US-Iran peace talks and a standoff over the Strait of Hormuz, the US Dollar (USD) struggles to lure buyers and remains on the defensive as bulls seem reluctant ahead of the crucial FOMC meeting this week. Moreover, a generally positive risk tone is seen undermining the Greenback's safe-haven demand and acting as a tailwind for the AUD/USD pair amid the Reserve Bank of Australia's (RBA) hawkish stance.
From a technical perspective, the recent range-bound price action might be categorized as a bullish consolidation phase against the backdrop of a rally from the 100-day Simple Moving Average (SMA), touched in March. Furthermore, positive momentum studies maintain a constructive outlook for the AUD/USD pair, suggesting that the path of least resistance remains to the upside and backing the case for an eventual bullish breakout.
The Relative Strength Index (RSI) holds above 60 without yet signaling overbought conditions and points to sustained upside pressure. Also, the Moving Average Convergence Divergence (MACD) histogram remains in a positive zone, indicating that the recent advance is broadly backed by upward momentum. However, a move above the 0.7185-0.7190 area, or the trading range hurdle, is needed to reaffirm the constructive outlook.
On the flip side, any corrective pullback could be seen as a buying opportunity and continue to find decent support ahead of the 0.7100 mark. A convincing break below the said handle, along with any loss of momentum in the indicators, would warn of a corrective phase within the broader bullish structure.
(The technical analysis of this story was written with the help of an AI tool.)
AUD/USD daily chart
Australian Dollar Price Today
The table below shows the percentage change of Australian Dollar (AUD) against listed major currencies today. Australian Dollar was the strongest against the Swiss Franc.
| USD | EUR | GBP | JPY | CAD | AUD | NZD | CHF | |
|---|---|---|---|---|---|---|---|---|
| USD | -0.02% | -0.00% | -0.02% | -0.03% | -0.25% | -0.13% | 0.02% | |
| EUR | 0.02% | 0.03% | 0.00% | -0.00% | -0.20% | -0.10% | 0.04% | |
| GBP | 0.00% | -0.03% | -0.02% | -0.05% | -0.26% | -0.16% | 0.02% | |
| JPY | 0.02% | 0.00% | 0.02% | 0.00% | -0.23% | -0.13% | 0.08% | |
| CAD | 0.03% | 0.00% | 0.05% | -0.01% | -0.23% | -0.13% | 0.05% | |
| AUD | 0.25% | 0.20% | 0.26% | 0.23% | 0.23% | 0.12% | 0.28% | |
| NZD | 0.13% | 0.10% | 0.16% | 0.13% | 0.13% | -0.12% | 0.16% | |
| CHF | -0.02% | -0.04% | -0.02% | -0.08% | -0.05% | -0.28% | -0.16% |
The heat map shows percentage changes of major currencies against each other. The base currency is picked from the left column, while the quote currency is picked from the top row. For example, if you pick the Australian Dollar from the left column and move along the horizontal line to the US Dollar, the percentage change displayed in the box will represent AUD (base)/USD (quote).
Author

Haresh Menghani
FXStreet
Haresh Menghani is a detail-oriented professional with 10+ years of extensive experience in analysing the global financial markets.