AUD/USD advances as softer US Dollar and RBA tightening outlook sustain bullish bias
- AUD/USD edges higher as a softer US Dollar supports the Aussie.
- Expectations of further tightening from the RBA underpin the Australian Dollar.
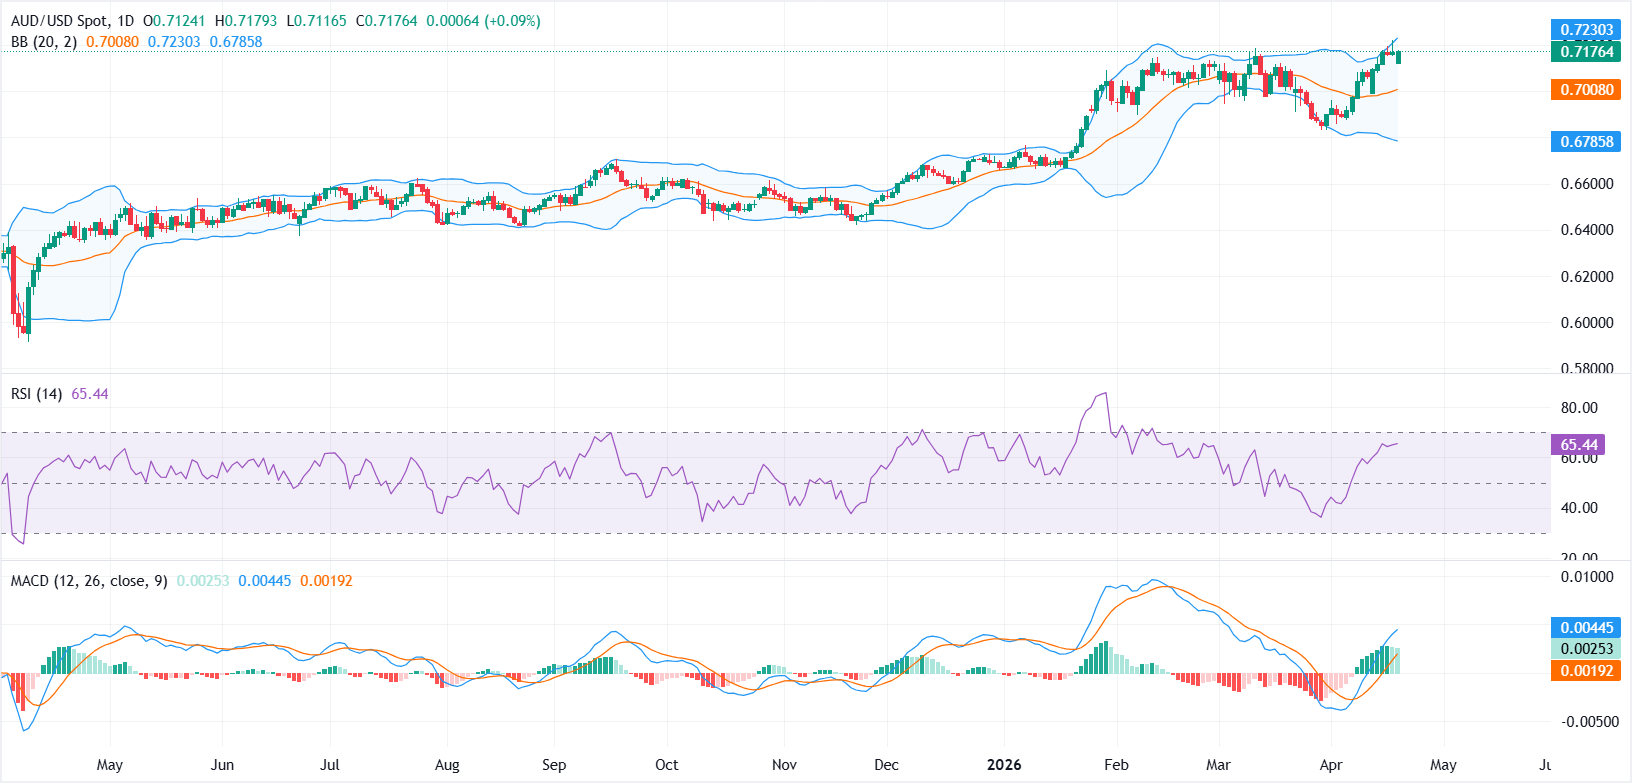
- Technically, AUD/USD maintains a bullish bias on the daily chart, holding above the 20-day SMA.

AUD/USD edges higher on Monday as traders reassess US-Iran tensions after tensions escalated over the weekend around the Strait of Hormuz, while cautious optimism over a potential deal continues to weigh on the US Dollar (USD) and support the risk-sensitive Australian Dollar (AUD).
At the time of writing, the pair is trading around 0.7176, recovering after opening the week with a bearish gap and touching a low near 0.7116.
Meanwhile, the US Dollar Index (DXY), which tracks the Greenback's value against a basket of six major currencies, is trading near 98.00 after opening the week with a bullish gap and touching a high of 98.49.
With the current two-week truce set to expire on Wednesday, markets are looking ahead to a potential second round of peace talks expected to take place in Pakistan. However, Iran has yet to publicly confirm its participation.
Meanwhile, elevated Oil prices are keeping inflation risks in focus and reinforcing the 'higher-for-longer' narrative for central banks. Against this backdrop, markets expect the Federal Reserve (Fed) to delay rate cuts, while the Reserve Bank of Australia (RBA) is expected to keep raising rates, as the surge in Oil prices adds to existing inflation pressure.
Overall, AUD/USD remains supported by a softer US Dollar and expectations of further tightening from the RBA, though any escalation in US-Iran tensions may limit upside and support a rebound in the US Dollar.
Technical Analysis:
In the daily chart, AUD/USD holds a clear bullish bias, trading well above the 20-day simple moving average (SMA) from the Bollinger Bands at 0.7008, which reinforces an underlying upward trend. Price is also comfortably above the lower Bollinger band at 0.6786, keeping the recent advance intact, while the upper band near 0.7230 acts as the next upside cap.
A rising Relative Strength Index (RSI) at 65.48 leans toward overbought territory but still supports persistent buying interest, and the Moving Average Convergence Divergence (MACD) indicator remains positive, hinting that bullish momentum is still in play.
On the topside, immediate resistance is aligned with the upper Bollinger band at 0.7230, where a daily close above would open the door to an extension of the rally.
On the downside, initial support emerges at the Bollinger middle band/20-day SMA around 0.7008, with a deeper pullback likely finding a stronger floor near the lower band at 0.6786; as long as the pair holds above these levels, the broader constructive outlook would likely remain intact.
(The technical analysis of this story was written with the help of an AI tool.)
US Dollar Price Today
The table below shows the percentage change of US Dollar (USD) against listed major currencies today. US Dollar was the strongest against the Japanese Yen.
| USD | EUR | GBP | JPY | CAD | AUD | NZD | CHF | |
|---|---|---|---|---|---|---|---|---|
| USD | -0.19% | -0.17% | 0.06% | -0.42% | -0.11% | -0.14% | -0.44% | |
| EUR | 0.19% | 0.02% | 0.24% | -0.25% | 0.08% | 0.06% | -0.27% | |
| GBP | 0.17% | -0.02% | 0.21% | -0.24% | 0.05% | 0.04% | -0.30% | |
| JPY | -0.06% | -0.24% | -0.21% | -0.46% | -0.16% | -0.23% | -0.50% | |
| CAD | 0.42% | 0.25% | 0.24% | 0.46% | 0.30% | 0.25% | -0.05% | |
| AUD | 0.11% | -0.08% | -0.05% | 0.16% | -0.30% | -0.03% | -0.34% | |
| NZD | 0.14% | -0.06% | -0.04% | 0.23% | -0.25% | 0.03% | -0.31% | |
| CHF | 0.44% | 0.27% | 0.30% | 0.50% | 0.05% | 0.34% | 0.31% |
The heat map shows percentage changes of major currencies against each other. The base currency is picked from the left column, while the quote currency is picked from the top row. For example, if you pick the US Dollar from the left column and move along the horizontal line to the Japanese Yen, the percentage change displayed in the box will represent USD (base)/JPY (quote).
Author

Vishal Chaturvedi
FXStreet
I am a macro-focused research analyst with over four years of experience covering forex and commodities market. I enjoy breaking down complex economic trends and turning them into clear, actionable insights that help traders stay ahead of the curve.


