- AUD/JPY remains mildly bid after mixed prints of Australia employment data for April.
- Convergence of 21-DMA, 50-DMA appears a tough nut to crack for buyers.
- Steady RSI directs sellers towards a four-month-old support line.
AUD/JPY consolidates the biggest daily loss in a week around 89.50 after the unclear signals from the Aussie jobs report for April were released early Thursday.
That said, Australia’s headline Unemployment Rate marched 3.9% forecast while refreshing the all-time low but a fall in the Employment Change to 4K, versus the market consensus of 30K and 17.9K prior, seems to have probed AUD/JPY buyers. It’s worth noting that the softer-than-expected prints of the Aussie Wage Price Index for Q1 2022 challenged the RBA hawks the previous day.
Read: Australian labour report leavs AUD sidelined, so far
AUD/JPY pair’s reversal from the 21-DMA and 50-DMA confluence, around 91.30, joins steady RSI to keep sellers hopeful.
Even if the pair manages to cross the 91.30 hurdle, a monthly resistance line near 92.50 will be testing the AUD/JPY bulls.
On the contrary, 50% Fibonacci retracement (Fibo) of January-April upside, near 88.10, restricts the short-term downside of the pair. However, major attention will be given to an upward sloping trend line from late January, around 87.70.
Should the quote drop below 87.70, the monthly low of 87.30 may act as the last defense for the AUD/JPY buyers before directing them to the 61.8% Fibo near 86.25.
AUD/JPY: Daily chart
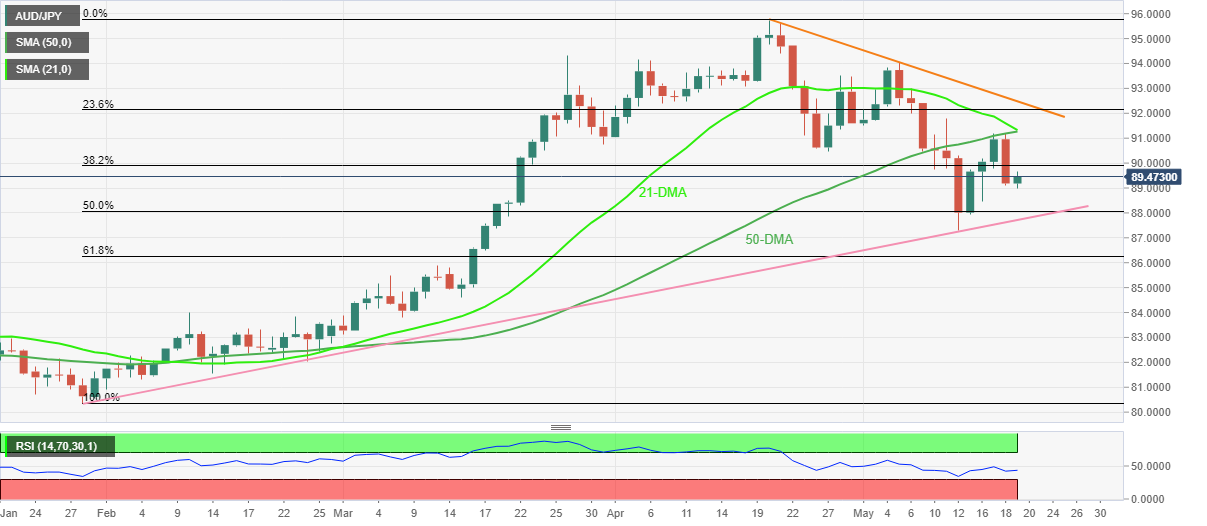
Trend: Further weakness expected
Information on these pages contains forward-looking statements that involve risks and uncertainties. Markets and instruments profiled on this page are for informational purposes only and should not in any way come across as a recommendation to buy or sell in these assets. You should do your own thorough research before making any investment decisions. FXStreet does not in any way guarantee that this information is free from mistakes, errors, or material misstatements. It also does not guarantee that this information is of a timely nature. Investing in Open Markets involves a great deal of risk, including the loss of all or a portion of your investment, as well as emotional distress. All risks, losses and costs associated with investing, including total loss of principal, are your responsibility. The views and opinions expressed in this article are those of the authors and do not necessarily reflect the official policy or position of FXStreet nor its advertisers. The author will not be held responsible for information that is found at the end of links posted on this page.
If not otherwise explicitly mentioned in the body of the article, at the time of writing, the author has no position in any stock mentioned in this article and no business relationship with any company mentioned. The author has not received compensation for writing this article, other than from FXStreet.
FXStreet and the author do not provide personalized recommendations. The author makes no representations as to the accuracy, completeness, or suitability of this information. FXStreet and the author will not be liable for any errors, omissions or any losses, injuries or damages arising from this information and its display or use. Errors and omissions excepted.
The author and FXStreet are not registered investment advisors and nothing in this article is intended to be investment advice.
Recommended content
Editors’ Picks
AUD/USD risks a deeper drop in the short term

AUD/USD rapidly left behind Wednesday’s decent advance and resumed its downward trend on the back of the intense buying pressure in the greenback, while mixed results from the domestic labour market report failed to lend support to AUD.
EUR/USD leaves the door open to a decline to 1.0600

A decent comeback in the Greenback lured sellers back into the market, motivating EUR/USD to give away the earlier advance to weekly tops around 1.0690 and shift its attention to a potential revisit of the 1.0600 neighbourhood instead.
Gold is closely monitoring geopolitics

Gold trades in positive territory above $2,380 on Thursday. Although the benchmark 10-year US Treasury bond yield holds steady following upbeat US data, XAU/USD continues to stretch higher on growing fears over a deepening conflict in the Middle East.
Bitcoin price shows strength as IMF attests to spread and intensity of BTC transactions ahead of halving

Bitcoin (BTC) price is borderline strong and weak with the brunt of the weakness being felt by altcoins. Regarding strength, it continues to close above the $60,000 threshold for seven weeks in a row.
Is the Biden administration trying to destroy the Dollar?

Confidence in Western financial markets has already been shaken enough by the 20% devaluation of the dollar over the last few years. But now the European Commission wants to hand Ukraine $300 billion seized from Russia.