Trend Trading Basics

What Is Trend Trading?
Trend trading is one of the most popular approaches to trading financial markets. The reason for this is the simplicity found in a trend trader’s strategy. If prices are typically rising, a trend trader will look to buy. When markets are declining, they will look sell. The key for a trend trader is to first determine the general direction of prices, and then look to join the wave of higher highs or lower lows.
What Makes a Trend?
Trend trading is all about direction, so before considering a buy or sell decision, trend traders will first identify if prices are rising or falling. Most bullish up trends can be seen on a chart as stair stepping as stocks reach higher highs and higher lows. Typically, in uptrends, traders will look to buy an underlying security. That’s not to say that there are not opportunities to sell, but a trend trader will usually trade with the prevailing direction of the market. The opposite is true with a downtrend. If a market is consistently dropping to new lows, a trend following strategy will elect to initiate new sell based positions.
As an example, below we can see a 4-Hour chart on BTC/USD. On the chart, the price of Bitcoin has steadily created a series of higher highs and higher lows. With this in mind, trend traders may look to plan new orders to go long in the market. In the event that prices begin a new trend and create lower lows, traders may then look to initiate new sell orders.

Technical Indicators for Trend Trading
To simplify the trend identification process, trend traders may also employ a series of technical indicators. Two of the most popular include Moving Averages and Donchian channels.
Let’s look at how these technical indicators can assist in trend trading.
Moving Averages
Moving averages are some of the most universally used indicators in markets. These charting lines are calculated by adding up a series of closing prices for a security and then dividing the total to find an average. If prices are seen as rising above the average, the trend may be interpreted as going up. If prices are declining faster than the average, the trend may be interpreted as downward.
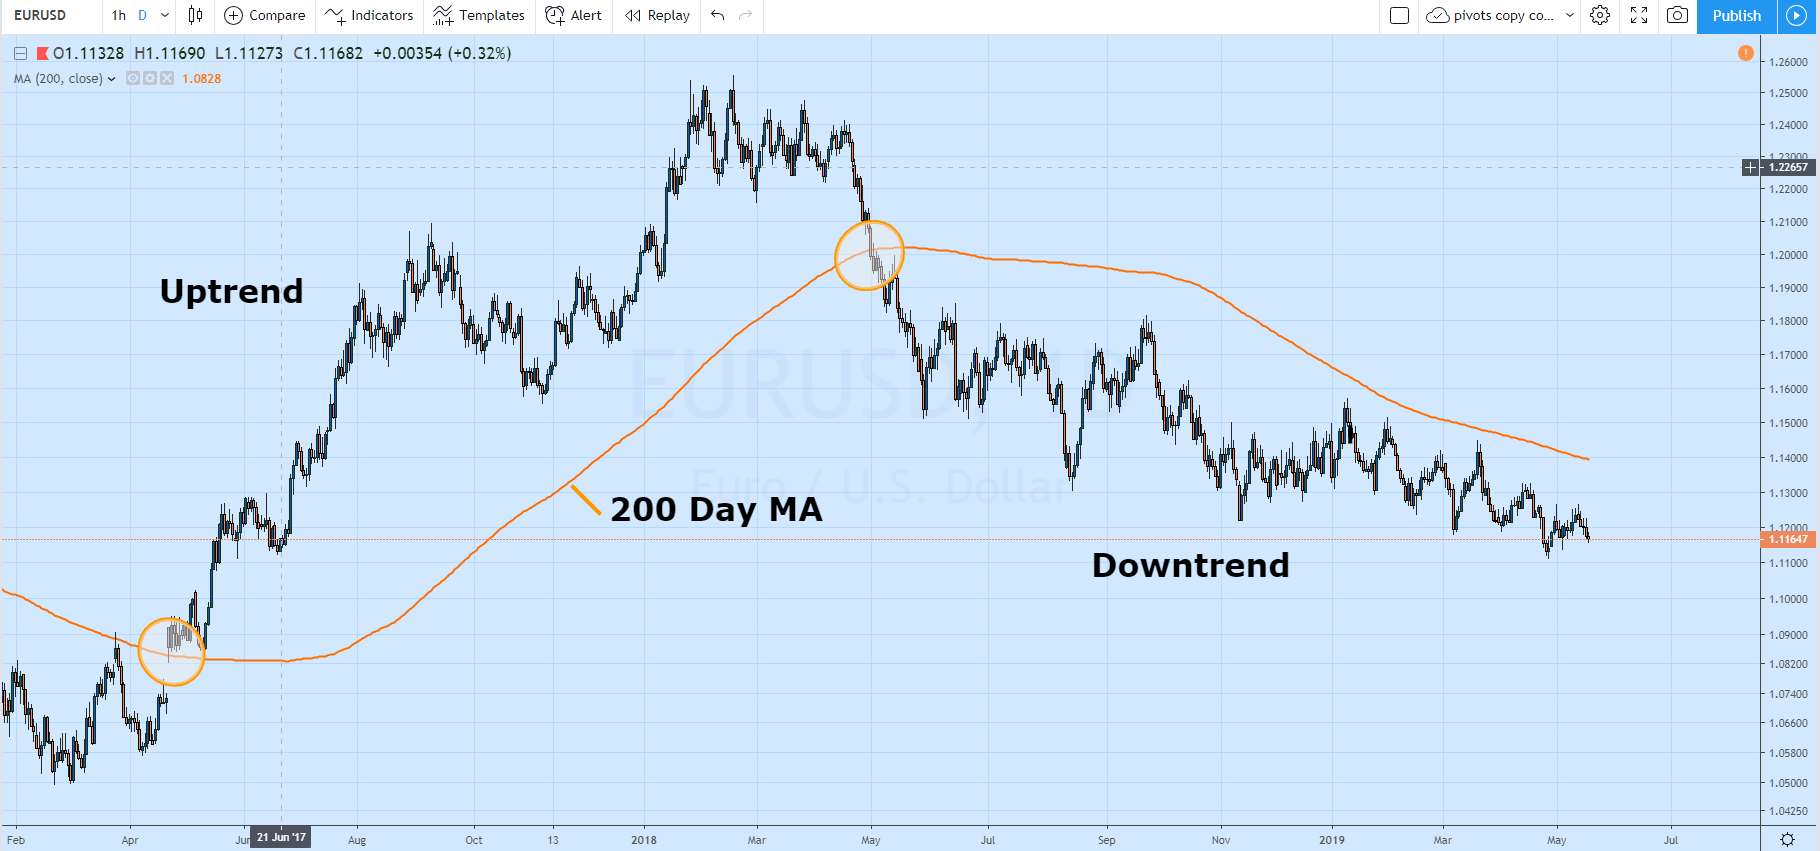
For example, using the EUR/USD Daily chart below, we can see a 200 period Simple Moving Average (MA) at work. When prices began trading above the average in April 2017, it was a strong signal that the EUR/USD was beginning to trend higher. Likewise, the EUR/USD is now trading back below the displayed average. This suggests that the EUR/USD is trending lower with the pair now residing just off of new 2019 lows.
Donchian Channels
The next indicator up for review is Donchian Channels. Donchian Channels are a handy indicator, as they are designed to display a chosen market’s previous high or low for a given period of time. As we learned previously, if markets are making higher highs the trend may be interpreted as going up. However, if markets are breaking through a lower Donchian Channel, selling in a downtrend may be considered.
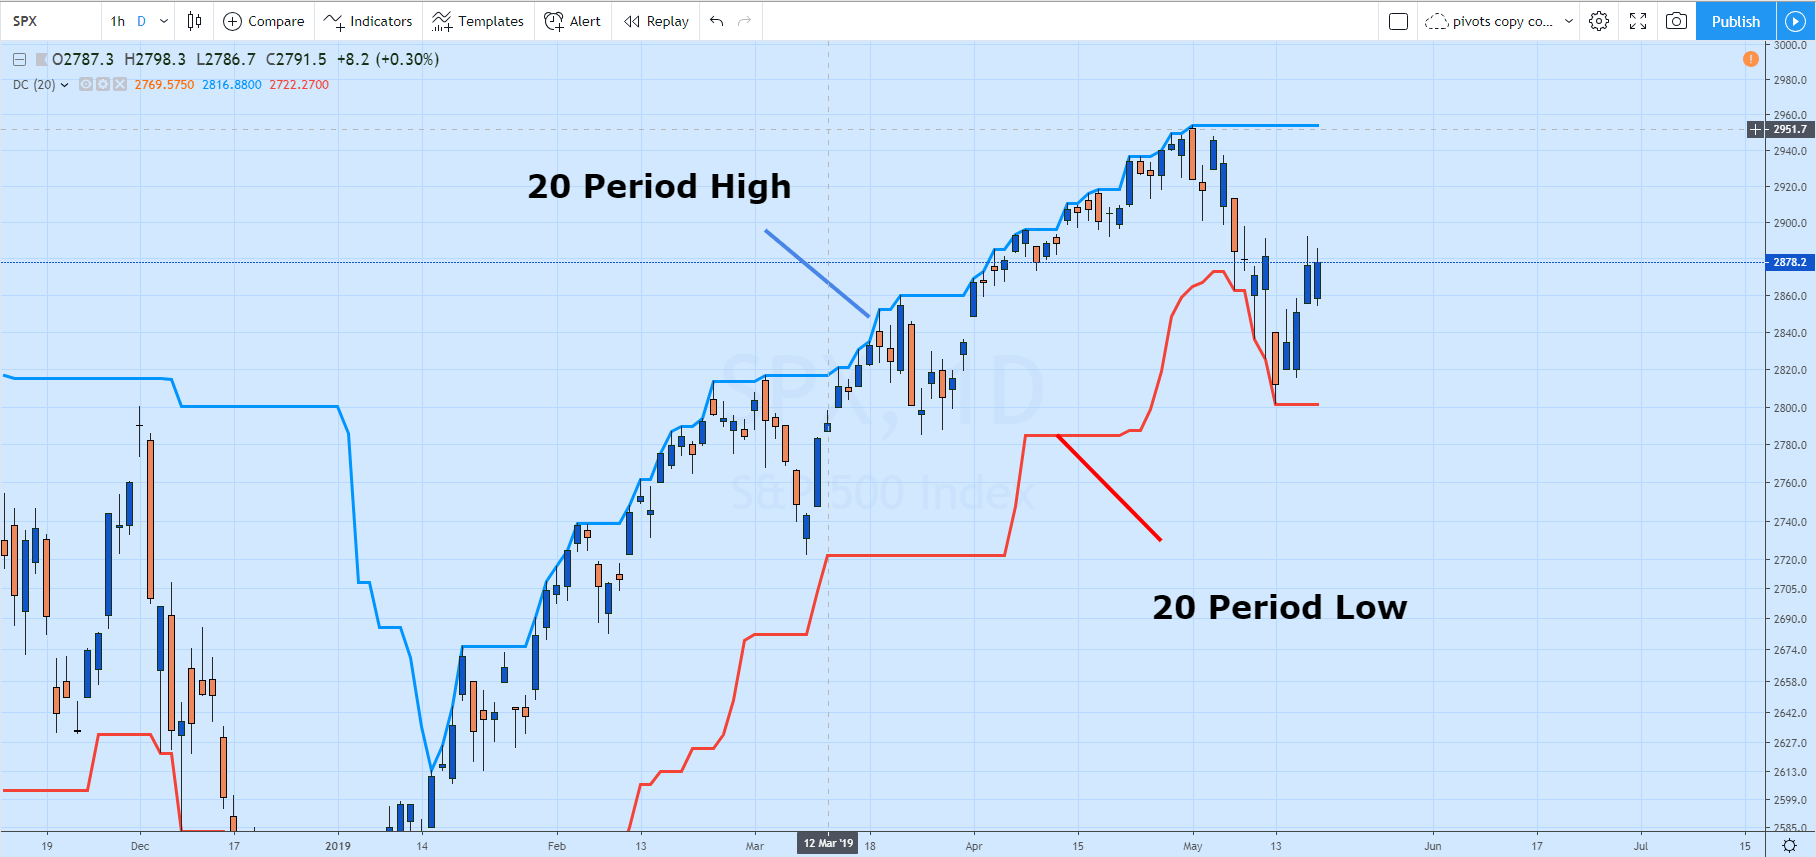
Referring to the chart below, we can see Donchian Channels in action on a SPX Daily chart with a 20 period setting. This means that the upper channel line represents the standing 20 day high, and the bottom line represents the current 20 day low. Traders should note that the SPX has previously been trending upward as the Index has steadily been creating higher highs. However, prices have recently moved to a new 20 day low. If the SPX continues to trade lower, trend traders may look for a new downtrend to emerge.
Time Frames for Trend Following
Finding the right time frame to chart is always a question to consider prior to placing a trade. The good news is that trends may be found on any time frame! One important consideration that trend traders should remember is that the higher time frame trends typically last longer than shorter ones. This means that trends can be found on 1 minute and 5 minute charts, but they would not be expected to last as long as monthly, weekly, or daily trends.
Risk Management for Trend Trading
Risk management should always be a consideration when implementing any strategy. Trend traders may employ any number of techniques to lock in profit as the market goes in their favor. One of the most popular methods is to use a trailing stop. Traders may consider using a previous low in an uptrend to set an initial stop and then trail their stop forward as new higher lows are created. Conversely, in a downtrend, traders may set a stop above a previous high. This way, as lower highs are created traders may consider trailing their stop and locking in profit as the trend progresses.
Trend trading is a popular method of following markets across asset classes because of its simplicity. Traders should remember that they can find trends on any chart, but the direction of the market should always be consulted before buying or selling. Then, as with any active trading strategy, risk should be managed as market conditions evolve. Now that you know more about the basics of trend trading, if you want to learn more about additional strategies that could help you make the right moves in any market condition, sign up for a free half day class.
Author

Walker England
Online Trading Academy
Walker England became an active trader just prior to the dot-com bust. This early experience in risk management taught him valuable lessons he shares with his students as an Online Trading Academy Instructor.


