Trading with Heikin-Ashi, A simple high low breakout method

The Heikin-Ashi charts are one of the most visually simple chart types when it comes to determining trends. Of course, there are times when price action can get choppy, but it entirely depends on how you trade with Heikin-Ashi.
Due to the nature of the way the Heikin-Ashi candlesticks calculate price, trends are clearly visible. What this means for the trade is that it offers many opportunities to trade the markets.
In this Heikin-Ashi trading strategy, we look at a high/low breakout method. We will not go into the details of how the Heikin-Ashi candlestick depict price. But traders should know that the (Heikin-Ashi) candlesticks are not as straightforward compared to the classic candlesticks or bar charts.
The Heikin-Ashi high/low method
After you apply the Heikin-Ashi candlestick indicator on your trading platform, the first step is to look at a prevailing trend. You need to have at least 7 - 10 trending bars that are formed consecutively.
After you identify this pattern, the next step is to look for the high or the low.
In a downtrend, you should identify the lowest high (preferably with a wick). While in an uptrend, you should identify the highest low (preferably with a wick).
The first chart below illustrates this set up.
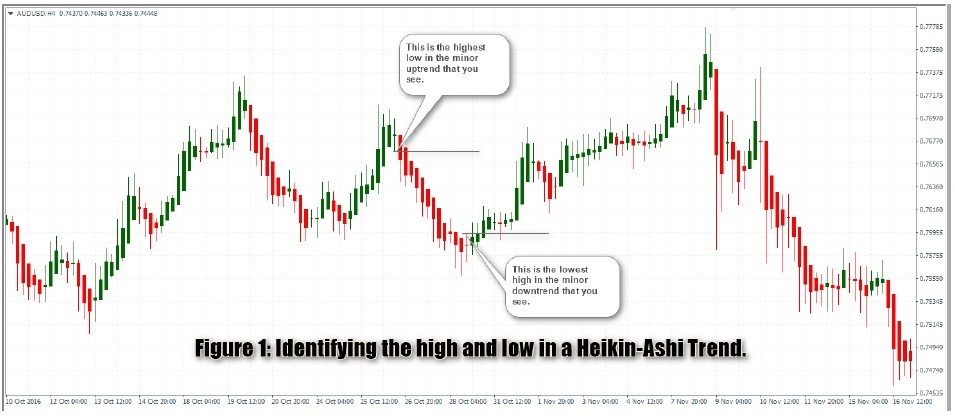
In Figure 1, we have two examples. In the first, you can see the higher low that is formed; this is our key market. In the second example, you can see the lowest high that is formed.
Mark this level with a horizontal tool.
To initiate a position, wait for a Heikin-Ashi candlestick to completely close above the lower high or below the highest low.
In Figure 2, you can see the long and short position examples.
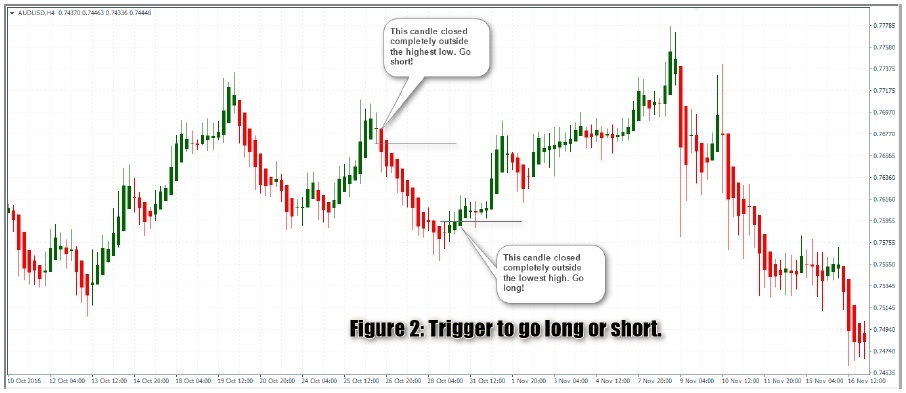
The candles that are marked are the ones where you go long or short when the Heikin- Ashi candle closes completely outside the horizontal level.
Stops can be placed at the recent high or low that formed prior to the trigger.
For take profit, you can either book a fixed 1:2 risk/reward set up, or book profits at regular intervals by initiating multiple positions.
Trade Example: The Heikin-Ashi high/low method
In Figure 3, we have an example of a long position. Here, we first identified a strong downtrend. Following this, we mark the lowest high that was formed at 0.9934.
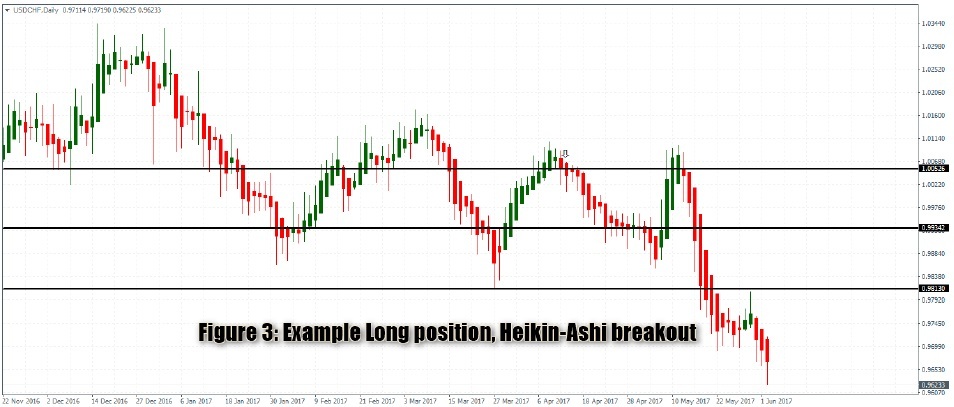
Two sessions later, we have a Heikin-Ashi candle that closes completely above this level. So, a long position is taken here with stops placed at the recent swing pivot low. This stop can later be adjusted as price moves in our favor.
The trade is then exited either after a certain number of pips depending on the timeframe this method is applied to or closed when you get an opposite signal. In the second instance, bear in mind that you will not always get an opposite signal and in some cases, price action could turn flat which can complicate a trade that has already banked some profits.
Therefore, some discretion needs to be applied as far as booking profits are concerned.
In Figure 4, we have an example of a short position that is stopped out.
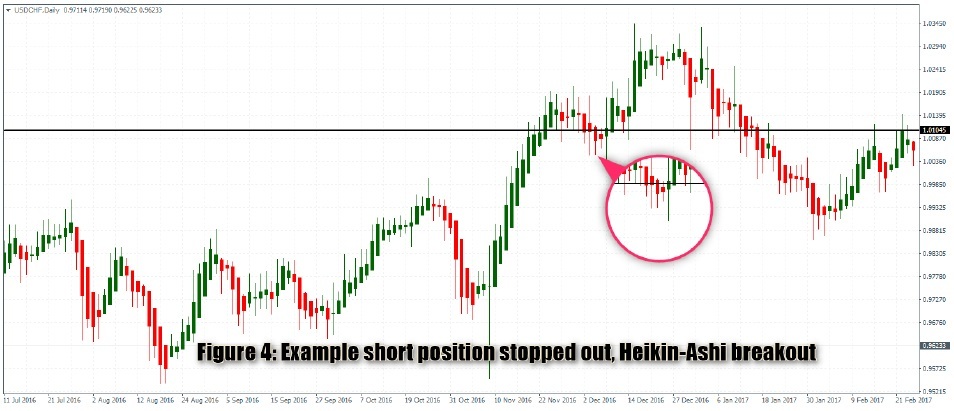
In Figure 4, despite price breaking out from the highest low, price slips initially only to reverse the trend and continue to post a new higher high. This happens, and that is why the stops are placed at the recent swing high.
Figure 4 also illustrates the point that not all trades need to be taken. Rather trade only those Heikin-Ashi set ups where the risk and reward can justify taking the trade.
In conclusion, the Heikin-Ashi candlestick breakout method is very easy to trade. With a bit of practice, traders can also hone their skills in identifying what signals to filter and what signals to trade that can give them a good risk/reward ratio.
Author

John Benjamin
Orbex
John is a market analyst for Orbex Ltd. and is a forex and equities trader having been involved in trading since late 2009. John makes use of a mix of technical and fundamental analysis and inter-market relationships.
















