Pre – Market Trading Opportunity

During my time on the floor of the Chicago Mercantile Exchange, I noticed many things that helped shape my thought process and strategy that I still employ today. I started on a very busy trading desk right next to the trading pits and my job was to facilitate institutional order flow.
Trading Opportunity
One of the many things I noticed was that most of the trading action happened very early in the day. Furthermore, bank and financial institution profits and retail trader losses happened at that same time, very early in the day. I realized that most of the time, when an institution was buying in a big way, there were many retail sell orders on the other side of that trade, and vise versa when the institution was selling. This was clear insight into the fact that this whole trading and investing game is a massive transfer of accounts each day from the people who don’t know what they are doing (retail novice traders and investors), into the accounts of those who do (financial institutions). I started to think… If I could just learn to identify where institutions were buying and selling in a market by looking at price charts, wow, this could be a really nice way to earn a very healthy living so that I could live the life I choose to live. Just working two hours a day early in the morning was icing on the cake, and I love icing. This is exactly what I taught myself to do.
Here’s how it goes… Most people are told not to trade the open of a market. They are told to let the market open and let it settle down for a bit before taking a trade. This is good advice if you are a novice trader, but if you do know what you’re doing you absolutely want to trade before, at and around the open as this is where the most predictable profits are for the day trader or pre-market trader. Institutions have big buy and sell orders in the market at specific price levels. Most people think you can’t figure out where those buy and sell orders are, but think again…
The screen shot below is of a trade I took last week. This was a supply zone in the NASDAQ Futures early in the morning, before the market open. Keep in mind that when I say supply and demand levels, I mean price levels where supply and demand are out of balance in a very big way, where banks are buying and selling, which is always where market prices turn. I am not talking about retail supply and demand or support and resistance; there is a big difference. The key is, knowing what that picture looks like on a price chart and that all comes down to a simple set of rules based on very simple logic.
Sam Seiden Trade: NQ Shorting Opportunity – 6/30/17
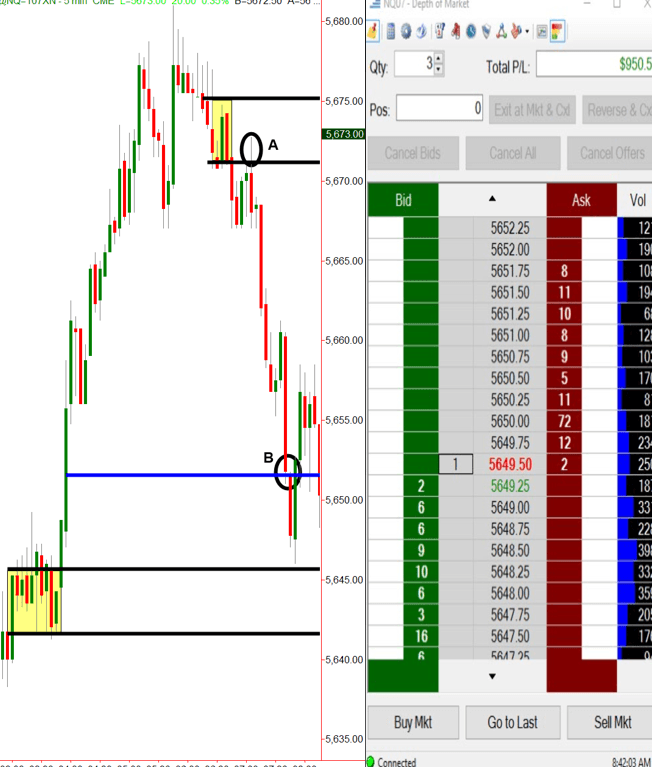
On a typical morning, it takes me about 30 minutes to analyze the markets I trade, identify the institutional demand and supply levels and put the buy and sell orders into the market. After that, there is no reason to spend time in front of the trading screens. After all, these days you can put your entire order into the market and leave it alone; set and forget trading.
In the trade above, I identified that banks were willing sellers at 5671 (supply). As you can see, price rallied back to the supply level (circle A) where I sold short. At the point of entry however, there was no reason to be in front of the computer screen if you had already put your entire order into the market. You may be asking yourself, what is so special about that area of supply, that picture…? Rules tell us that there was plenty of willing supply in that area. Could the trade have not worked out? Sure, but that’s ok because the loss would have been very small.
How do the profits work? Let me explain… Let’s start with the supply level to the left of circle A, where the two black supply lines begin with the yellow box. Price falls from that level because supply exceeds demand. Do you or does anyone you know have an account size large enough to create a supply level like that in the NASDSAQ, one of the biggest equity index markets in the world? Probably not. So, if it’s not your supply, who’s supply is it? It’s a big bank or institution’s supply.
Next, let’s focus on the circled area on the chart, where price rallies back to the area, which is where a seller was according to our rule based strategy. Lets specifically focus on the buyers. Who is buying in the circled area when I am selling? Is it a consistently profitable buyer or a novice buyer? Only a novice buyer would buy after a rally in price like that and into a price level where supply exceeded demand. So, what you have at that moment is a novice buyer buying against a financial institution’s sell order.
Really think about that for a moment. You have the smartest, most profitable seller, selling when the most novice buyer is buying. The outcome of that battle is VERY predictable. This very unbalanced equation or battle almost always takes place in the first two hours of a trading day which includes market time before the NY open. The nearest area of demand was quite a bit lower, at 5645, so I took my profits at 5653 with three NASDAQ futures contracts for a profit of $950.00. I wanted a bigger position but didn’t get filled on the whole order. This is all basic buy at wholesale, sell at retail, really nothing different. The key is to see this on any and all price charts.
For active traders, this strategy takes about an hour or so a day to employ, in the early morning, if you have the time. The key is knowing what the picture of institutional demand and supply looks like on a price chart, understanding the simple rules of the strategy, and having two hours in the morning to execute the analysis and strategy. Then, go live your life. 20+ years ago I knew I wanted to live life on my terms, I just didn’t know how to create the income that would allow that. That desire drove my focus on trading and still does today.
Hope this was helpful, have a great day.
Author

Sam Seiden
Independent Analyst
Sam began his career at the Chicago Mercantile Exchange, the largest financial exchange in the world where he facilitated institutional order flow.
















