Inter-Market Cues
There has been a lot of discussion on the news channels about the recent rise in interest rates and the comments by the RBI that they will attempt to control inflation at the expense of some economic growth. There were several fundamental analysts and even an announcer on one of the channels stating how the stock markets are near their bottom. A day later, another analyst from a major firm was quoted in saying that they believed the Sensex should reach 21000 by year's end. It is no wonder so many of these same people lost money trying to buy the bottoms in 2008.
While studying for my Chartered Market Technician's designation, I had to learn a lot about how the different asset classes such as commodities, bonds and equities work together in the markets. In my last week before leaving India, I held a series of special graduate sessions to discuss Inter-Market Analysis and its effect on trading. Some of the assets are substitutions where traders/investors place money in one or the other causing them to trend oppositely. Other asset classes are complementary, and will move together with a slight lead or lag. In my trading and studies, I have found this useful for predicting probable market behavior.
When trading on a longer time frame or investing in the stock markets, I will typically look to the bond markets as a leading indicator.
Many people mistakenly believe that bond prices and stock prices move in opposite directions. They state that money is withdrawn from stocks when the markets crash for the safety of bond yields. However, this is only a temporary phenomenon. Continued purchases of bonds would cause interest rates to drop and free up more capital for economic expansion. This in turn would lead to a stock market rise.
The same is true for higher rates from investors selling bonds. If rates continued to climb, then money becomes tight and businesses cannot expand by borrowing at cheap rates. Their revenues and earnings will suffer as higher interest leads to slower spending in the economy. Add to this the actions of the RBI to raise rates and control inflation and stock prices will soon follow the lead of bond prices downward.
Looking at the chart of 10 year India bond yields, you can see how the Nifty has reacted to movements of the 10 year Indian Government bond yield changes in the past. Remember, I am showing the chart of the yields which will move opposite to the stock market.
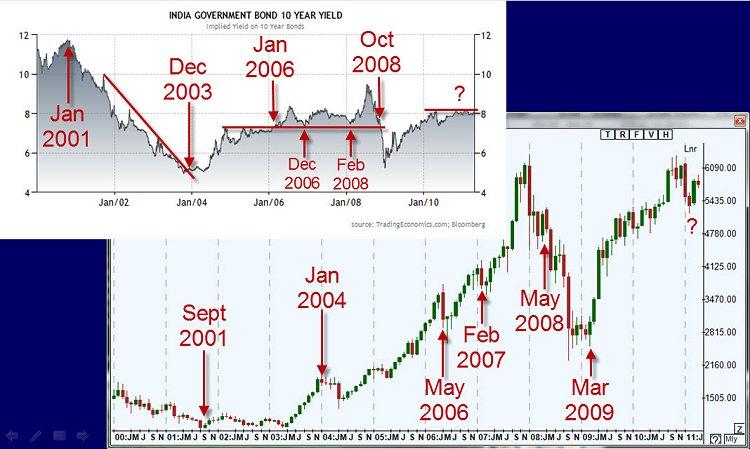
In January 2001, the bond yields peaked corresponding with a bond price bottom. The rising of the bond rates led the bottom of the stock markets after the tech bubble burst. The Nifty struggled a little in 2002 and early 2003, but always maintained higher lows.
When the bond yields broke their downtrend, it signaled a warning sign for the Nifty after the dramatic rise in late 2003. The May 2004 drop wipes out gains from the previous seven months. The resistance level formed in bond yields broke in January 2006 and became a future support area. The break led a drop in May. The yield's bounce off that support level gave warnings prior to drops in both February 2007 and the continuation of the bear market in 2008. The end of that equity bear market was preceded by the bond yield finally breaking the support level it had tested so often before. Lower rates allowed for renewed buying into equities. With the current policy of the RBI pushing rates higher, it would be nearly impossible for the Nifty to rise and indeed it has been in a decline since November 2010. We have been pressuring a resistance level on the gilt yields, which if broken, could be a warning of a market drop within the next few months.
Author

Brandon Wendell, CMT
Brandon Wendell
Brandon started off in the industry as a retail stockbroker working the phones. With a thirst to learn more about market mechanics, he moved into back-office operations handling order flow as an Agency Desk Operator for a major brokerage.
















