Creating a Commodity Spread Chart
My last five classes have been instructing the Commodity Futures course that we offer at Online Trading Academy. I am so excited about all the interest there is in the Commodity asset class and for good reason, too. With the world population continuing to expand and as more countries are becoming more developed, there is going to be more demand for these Commodities than ever before. In my last article, I described what a Commodity Futures contract was and how much we use these products on a daily basis - Meeting the Commodity Family.
One of the more frequent questions I get now from the Commodity class traders is, how do you create a Spread chart? I will walk you through the process of creating these Spreads from a seasonal pattern in Soybeans. Moore Research Company, Inc. (MRCI) has a seasonal Spread pattern that I have chosen to show you. As I have mentioned before, I like to receive reports from MRCI each week and look for a seasonal window of opportunity to trade a particular Commodity or Spread. The report MRCI sends out helps to narrow down my selection of markets to start doing my weekly analysis on with high probability setups, much like a stock screener does.
If you have an interest in looking at these seasonal reports, MRCI is still offering their special 2-week free trial. Contact Melissa Moore at (800) 927-7259, or email [email protected] . Let her know you heard of this offer through Online Trading Academy for the trial.
The Spread we will be looking at is in the Soybean complex. Please keep in mind that this article is for educational purposes only and is not in any way a solicitation for you to trade this particular Spread. We will be looking to buy the July 2010 Soybeans and simultaneously, sell the November 2010 Soybeans. Or another way of looking at the same Spread is SN2010/SX2010. The window of this seasonal pattern runs from April 8th to about May 7th. This particular trade will only be on for about 30 days. The amount of Margin you will need per Spread contract will be $1,215 Initial and $900 Maintenance. While this amount sounds high, compare that to what it would cost you to trade an outright Soybean Futures contract: $3,713 Initial margin and $2,750 Maintenance margin. Trading Spreads with lower margin requirements can allow smaller size accounts to trade multiple contracts for scaling out of their positions at different levels.
According to MRCI, over the past 15 years, this trade has been profitable 12 out of the 15 years. The average winning trade was $697, while the average losing trade was $83. Keep this in mind; these results are if you had taken the entry every year on the entry date and exited on the exit date. Neither MRCI or Online Trading Academy recommends that you take any of these trades based just on the seasonal recommendations. Instead, we recommend that you combine these high probability trades with other technical and fundamental tools to control your risk. On any given year, a seasonal trade can go bad based on other factors that were not present during the research time of the previous 15 years. Extreme weather is one of the biggest factors that can override a good seasonal trade.
I would like to insert the analysis comment from Jerry Toepke of MRCI that accompanied this seasonal report. You will find an excellent blend of technical and fundamental information to support your trading decision.
Now consider soybeans. The new crop is planted mostly from late April into early June and harvested mostly in October. The USDA crop marketing year runs September-August, but so few soybeans are harvested for delivery against September futures that November best represents new-crop. Because soymeal normally accounts for 55-65% of product value and is consumed most heavily in the cold of winter, US processors crush aggressively from harvest through March. Along with heavy exports during and immediately after harvest, far more than half the year's production of soybeans has usually been consumed in the first half of the marketing year.
The remaining old-crop supply must stretch and gets ever tighter through September until the next harvest, which even in April is still but a twinkle in producers' eyes. Where the Corn and Soybean Belts overlap, corn is usually planted first. As it goes in the ground in April, acreage that could otherwise go to soybeans is used, thereby making tight physical supplies ever more precious. Thus, from February into July, when the new crop is more secure and market anxiety eases, ever tightening old-crop has tended to outperform new-crop, production potential for which grows when planted. During much of April, this dynamic has been particularly reliable. In fact, the Long July/Short November Soybeans spread has closed more favorably toward July on about May 7 than on about April 8 in 14 of the last 17 years. In only one of those 17 years would any daily closing drawdown have even reached 8.00 cents/bushel, and none of the three losses would have exceeded 3.00 cents/bushel. (Each 1.00 cent/bushel is worth $50/contract. Brokers will accept nominal spread orders.)
The 2009 version of this spread traded to a premium greater than 240.00 cents/bushel prior to expiry. As last year's crop was experiencing harvest difficulties in October/November, this year's spread traded almost down to even money. By December it had run up to almost 50.00, only to fall back and retest 20.00 in February and in mid-March. But it then recovered and even appeared to break out to as high as 54.25 on the day before the USDA's Grain Stocks and Prospective Plantings reports.
The negative reaction to those reports has now sent it back to retest 20.00. Supplies are plentiful; but demand from China has been strong and, if large South American crops are harvested late or shipping is disrupted, US soybeans could get a late surge of demand. As long as 20.00 holds, the spread may well rise again.
Now that we have selected our market to do our technical analysis on, we will need a chart. The majority of Spread charts are done as Line charts – not the usual Candlestick chart style. Let's examine the process for building a Spread chart in TradeStation.
Step 1: We will open a daily chart of the July 2010 Soybean chart. Type the symbol SN10 and Figure 1 will appear on your screen.

Step 2: Right click on the chart and a menu appears. Scroll down the menu and select "Insert Symbol."
Step 3: When the Insert Symbol box opens, we will want to place the other part of the Spread in this box. Here we type SX10. Then click the Plot button to the right of the symbol you just entered. You will now have a chart that looks like Figure 2. The chart on top is the July Soybeans and the chart on the bottom is the November Soybeans.
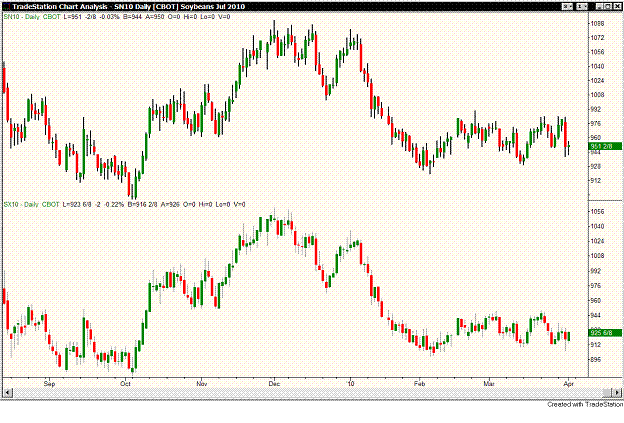
Notice that in Figure 2, I plotted the July Soybean contract first. That is because we are looking to buy the July and sell the November. When plotting Spread charts, always put the buy chart first. When you plot your chart this way, the spread chart will be like any other chart as far as values go. If the Spread line is going up, you are making money; if the Spread line is going down, you are losing money.
Step 4: Right click on your chart and locate Insert Analysis Technique. When the Insert Analysis Technique menu comes up, you will scroll down to Spread – Diff. Click OK. Another window will open to allow you to change other settings on the chart, but at this time, we just want to click OK. Your new chart will now look like Figure 3. The top chart is July Soybeans, the middle chart is November Soybeans and the bottom chart is the Spread of July Soybeans/November Soybeans.
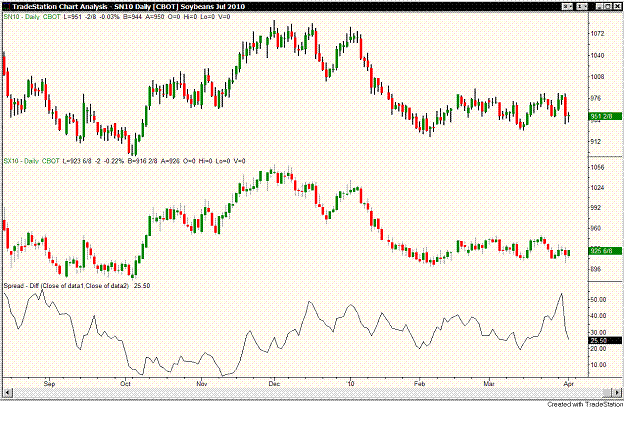
And there you have a Commodity Spread chart on TradeStation. These charts can be intra-day, Daily, Weekly or Monthly.
You can also rearrange these charts, or make them the primary chart in the window.
-
Right click on your chart page and find Format Analysis Techniques
-
Select Spread-Diff and then click Format
-
From Format Indicator: Spread-Diff window, select Scaling
-
Under Axis you will find Sub-Graph with a drop down window
-
By changing this number, you change how the graphs are displayed in different panes in your chart window
Now that we have created our Soybean Spread chart, I would like to show you relative strength/weakness on these charts. Figure 4 will show you how the July (top) contract is relatively stronger than the November (middle) contract.
-
Notice how the trendline is sloping upward at a steeper incline on the July contract compared to the November (July is stronger)
-
During this last sell off (2 bars previous) from the Planting Intentions report, notice how November penetrated the trendline and July barely got back to the trendline
Our Spread trade has us Buying July and Selling November Soybeans. By looking at the relative strength of these two contracts, we can see that the individual markets help confirm our Spread strategy.

Also, in Figure 4 I have placed a horizontal line at the price of 20 in the lower Spread chart. You can see how we have touched this in the past and bounced from there. This third touch would have me a little nervous because we know that each time a horizontal line is touched, it gets weaker. I like the fundamentals that Jerry Toepke pointed out in this trade and will keep that in mind for my analysis of this trade.
I also plotted a diagonal trendline on the Spread chart from the November lows to the March lows. This line actually will intersect closely to the 20 dollar level on the Spread. More added confluence at this price level.
Now that we can build our own Spread charts, you, too, can do your own technical analysis of the Commodity markets. These Spreads work well with Stocks, also. For example, you can spread GM/Ford, Verizon/AT&T and the list goes on. The only limit you have to creating your Spread charts is that you must subscribe to the exchanges that the products trade on for the data feeds.
Trading Spreads is like looking at the markets in another dimension. This allows you to find trading opportunities that other traders may miss if they are not aware of Spread trading. Spread trading will take some practice to get used to, but by practicing with your new Spread charts, you will be expanding your trading opportunities.
"It's not what you do once in a while, it's what you do day in and day out that makes the difference" Jenny Craig
Author

Don Dawson
Online Trading Academy
Don has been trading the futures markets for 20 years. His perseverance through the ups and downs of trading, openness to experience of others, balanced tolerance for risk and patience to wait for his setups are a few of his strengths as a trader.
















