Use the sixty-forty bounce or break for greater profits

Many traders depend on technical indicators to decide whether to buy or sell stock. Online Trading Academy instructors stress in our courses that the indicators are derivatives of price and/or volume and are therefore lagging. Our decisions are to be based on price itself and the indicators can be used to help support our decisions, but should never be taken as the decision maker themselves.
In some recent articles, I have talked about how to determine if a supply or demand level is more likely to bounce or break. When used properly, technical indicators can assist us in determining the strength of the trend. When we have trend strength increasing, we are more likely to break out of the supply or demand zones and continue in the trend. However, when the trend shows weakness, there is a higher probability of a bounce and either a retracement or reversal.
The key thing is to use the indicators correctly. Most books on trading are regurgitated notes on classic trading techniques that may work from time-to-time. We can't make money from time-to-time and need something fresh and more reliable to depend on. That is why I am thankful for the instructors I have had as a past student and now work with at Online Trading Academy. They offer real strategies that have consistently worked in the markets.
Well, I would like to add a twist to a classic indicator that I have learned through study and experience in the markets and with the right mentors. Most traders are familiar with the Relative Strength Index or RSI. It is an oscillator that measures the strength of up or down moves in price relative to the stock's previous price movements. The typical readings for this indicator are 70-30. A reading of 70% means that the stock is overbought and likely to drop soon. The RSI crossing below the 70% line is sometimes taken as a sell signal. Conversely, a reading below 30% shows the stock to be oversold and perhaps ready to rise. A buy signal is said to be generated when the RSI crosses above 30.
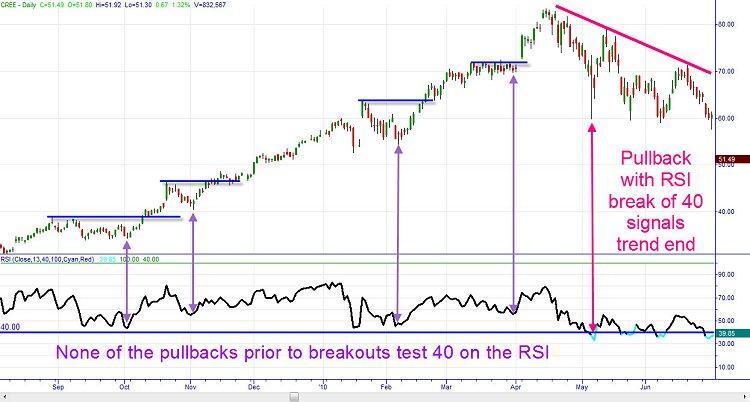
In a prior Lessons From the Pros article called, "It's All Relative," from October 31, 2007, I discussed the problem with using the traditional signals of the RSI for buying and selling. In that article, I mentioned that in a strong uptrend, the RSI will typically use 40 as a support level.
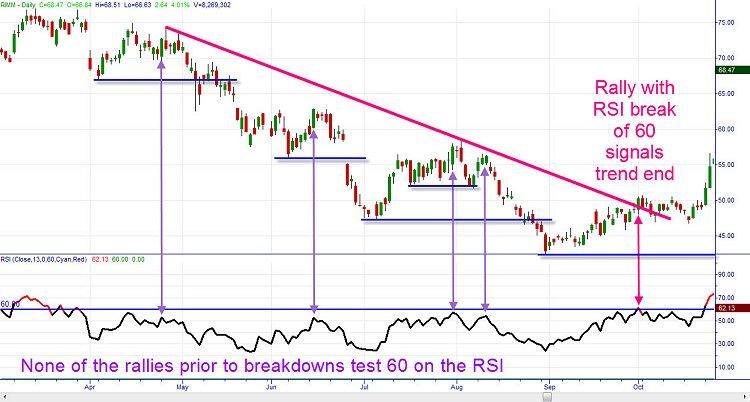
And when price is in a strong downtrend, the RSI will use 60 as a resistance level. In that article, I detailed adjustments that may need to be made to use RSI as a valid indicator in strong trends. However, there is another method I would like to discuss here.
When we are trading in the trend, we want to let our profits run as long as possible and do not want to enter into trades with a low probability of working. We can use the RSI with those new parameters to help us identify some of those opportunities as we approach supply and demand levels. In an uptrend for instance, we want to hold longs as supply breaks and prices move to higher levels. If we see on pullbacks that the price fails to break 40 on the RSI, then you are still in a bullish trend and are likely to break the subsequent supply level. However, once that 40 level is broken, then you would expect the trend to pause or reverse and profits may need to be booked at the supply levels.
In a downtrend, we want to let our shorts go as far as possible to maximize profits. When we see rallies in the bearish trend fail to breach the 60 level on the RSI, then we are still in the downtrend and are likely to see prices continue to break demand levels. However, once that 60 level has been broken, be alert to take profits at demand as the trend is likely to change.
Remember to trade with the trend and look at price to help support your decisions to enter or exit trades. We want to let our profits run as much as possible and even though it is easier said than done, we can do better if we feel more confident in our ability to analyze the price action on the charts. Greater profits will make up for any small losses we may incur and lead us down the road to profitable trading. Until next time, trade safe and trade well!
Have a great day.
Author

Brandon Wendell, CMT
Brandon Wendell
Brandon started off in the industry as a retail stockbroker working the phones. With a thirst to learn more about market mechanics, he moved into back-office operations handling order flow as an Agency Desk Operator for a major brokerage.