Spotting Fed Action
Much has been said recently about the proposed Quantitative Easing Part Two (QE2) program currently in progress by the Federal Reserve. Whether or not this will help the struggling US economy is yet to be seen. However, the simple fact that there had to be a QE2 signals the effectiveness of QE1. Politics aside, there is a technical way that you can identify when Fed actions are taking place. You can use this technique to identify potential trend changes and judge the strength of current trends.
To regulate monetary policy, the Federal Reserve (The Fed), will purchase and sell treasuries in the secondary market. The effect of this is to change or stabilize the interest rates and/or the amount of money available in the business environment. There is an immediate effect that you can see when they enact their policies in the Treasury markets.
Not all Treasuries are created equal. They range from a maturity of 13 weeks out to 30 years. Logic would dictate that an investor who is lending money to the US government for 30 years would expect a higher rate of return than someone who is only lending for a few weeks to a few years. That is why, typically, the longer a Treasury's maturity, the higher the interest paid. Short-term treasuries are going to be much more sensitive to interest rate manipulations than longer term as investors are not locked in and can shop for alternative investments that offer better returns.
The yield curve is a chart created by joining the yields of the different maturity treasuries together. A normal yield curve slopes upwards as the yields get larger with longer maturity treasuries.
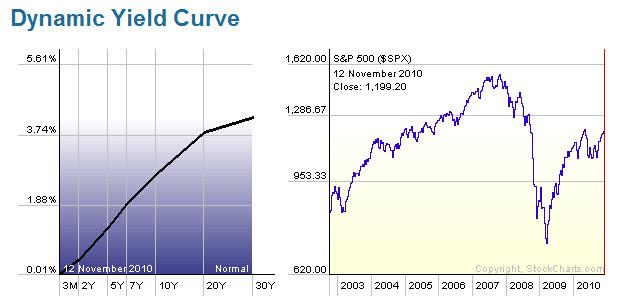
As I mentioned earlier, the shorter term maturities are more sensitive and when the Fed tightens monetary policy to slow down inflation, you will see the reaction first in the short-term treasuries. This will cause the yield curve to flatten or even invert as the two year or less treasuries yield the same of more than the longer term bonds. This usually precedes recessions, however, a flat or inverted curve doesn't necessarily mean a recession is imminent.
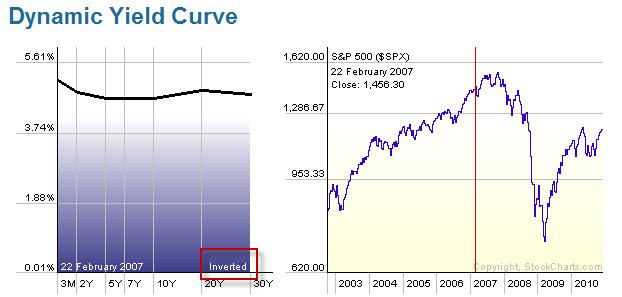
When the Fed intervenes in the markets to bolster or slow down the economy, you can see this from the changes in the yield curve.
Typically, the shorter term treasuries will move faster in reaction to Fed actions than the longer term. One thing we can look to in order to spot Fed intervention into the treasury markets is the movement of the short-term treasury notes in relationship to the long-term treasury bonds.
Bond yields move opposite of the price of those bonds. In times of Fed easing (lowering rates to stimulate the economy), they will typically buy treasuries to put more money into the economy to accomplish the lower target interest rate. If we look to the yield curve, you will see the rates on the shorter term notes and bills (maturities of less than 10 years and one year respectively) move down faster than the longer term bonds. This will be seen as a divergence in the prices of those treasuries on the charts. If the short-term treasury prices rise faster than the long, then the Fed is easing. The effect of this will be a bullish move in the equity markets as well.
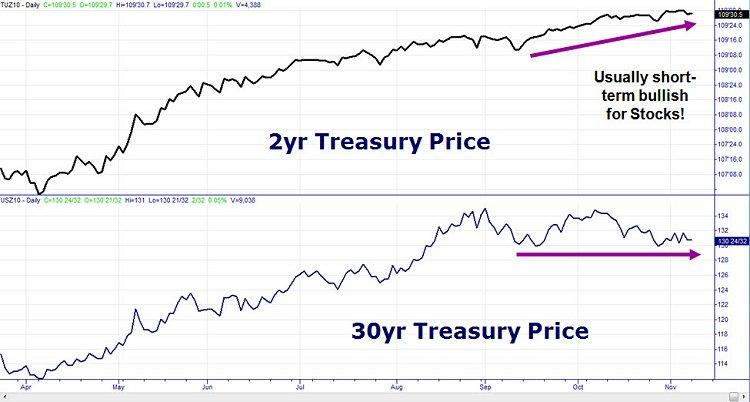
The opposite is true for times of Fed tightening. You will see the short-term treasury prices drop faster than the long. As a longer term swing trader, we want to determine if the rallies or drops in the equity prices are being driven by the free market or by government intervention. Rallies caused by government intervention in equity markets are usually not long lasting and should be traded with caution unless the institutions and individuals start to buy into them as well.
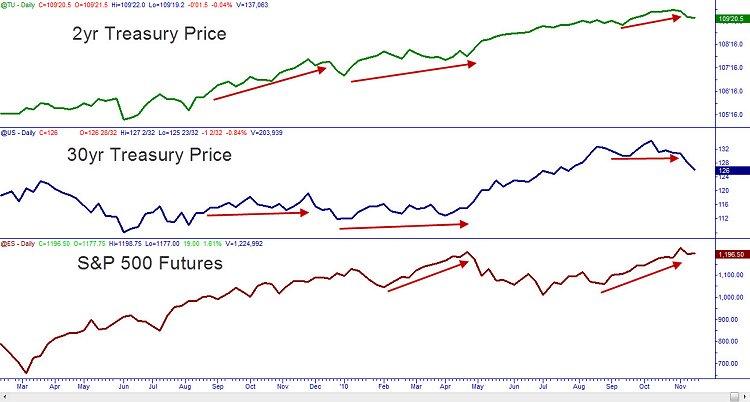
So watch the bond market for clues as to how the equity market should proceed. Having this knowledge can help you increase your chances of spotting the Fed action and identifying potential dangers in trading. Until next time, trade safe and trade well.
Author

Brandon Wendell, CMT
Brandon Wendell
Brandon started off in the industry as a retail stockbroker working the phones. With a thirst to learn more about market mechanics, he moved into back-office operations handling order flow as an Agency Desk Operator for a major brokerage.
















