How to Trade Using Elliott Wave Analysis
Elliott wave analysis is useful in providing the most likely next direction, but often traders may be unsure exactly when to enter and exit based upon analysis.
If the market is predicted to move lower then obviously you would go short. If your wave count expects price to move upwards then obviously you would go long. Trying to trade against the main trend is extremely risky. The wave count should tell you what the main trend is.
Invalidation points are the most obvious place to put stops, and targets are the most obvious point at which to take profit. But this does not tell you where to enter a trade or how to add to your position.
In an effort to bridge this gap I offer the following. Please feel free to add your own comments and suggestions.
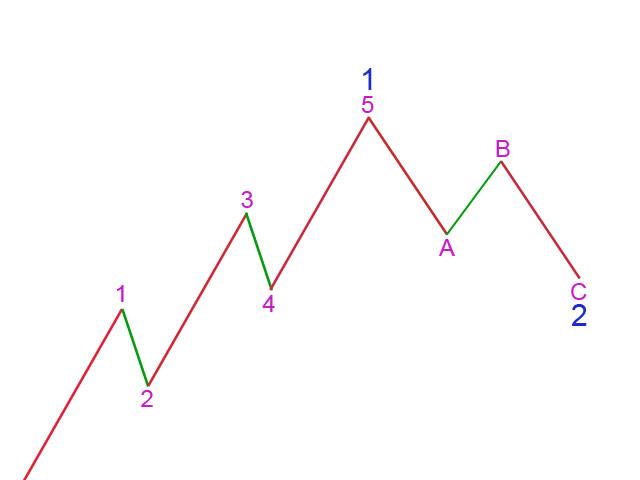
Using Elliott wave analysis we want to trade the actionary waves within the basic structure.
Actionary waves are waves which carry price in the direction of the main trend. Within an impulse (or a diagonal) actionary waves are 1, 3 and 5. Within a correction actionary waves are waves A and C.
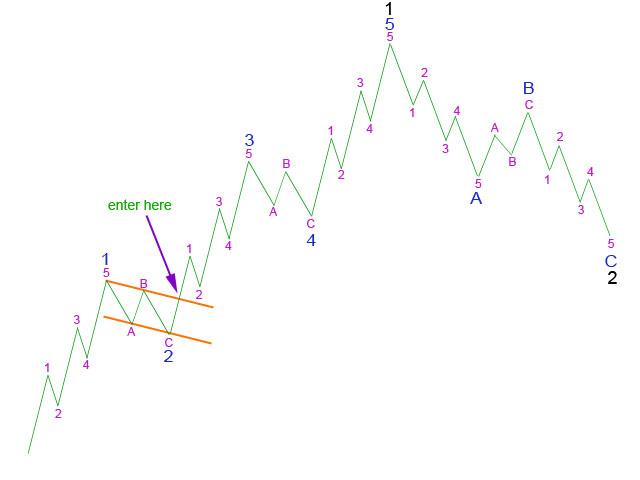
For each actionary wave the method is similar. Draw a trend channel around the prior reactionary wave. When the channel is breached then the next actionary wave should be underway, at that point enter a trade in the direction of the main trend. For the example above we enter a long position to trade the third wave upwards when price moves above the small orange channel containing the second wave zigzag.
When do you exit this trade?
You would calculate a target at which point you could close the trade and take profit. However, targets are not always met. If price falls short of the target how do you know when to get out?
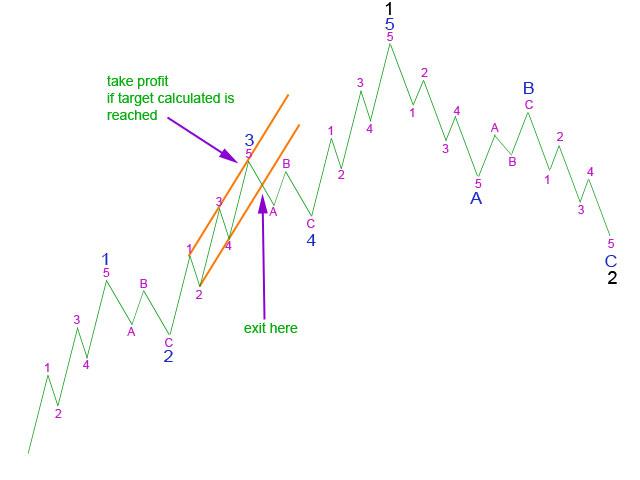
Using Elliott’s technique we draw a trend channel about the impulse which here is a third wave. Draw the channel from the highs of 1 to 3, and place a copy on the low of 2. If this does not contain wave 4 then redraw the channel as follows: draw a trend line from the lows of 2 to 4 and place a copy on the high of 1. If neither of these methods work then construct a “best fit” channel which contains as most of the movement as possible.
When the channel is breached in the direction opposite to the main trend in which you are trading then you should exit the trade.
In exactly the same manner you would enter a trade for a fifth wave when you have confirmed that the fourth wave is complete:
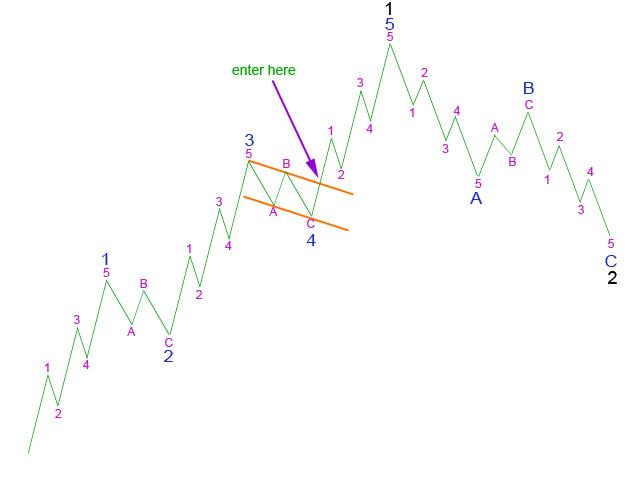
And you would either take profit at your calculated target if price reaches the target, or you would exit the trade when it is clear that the trend has changed.
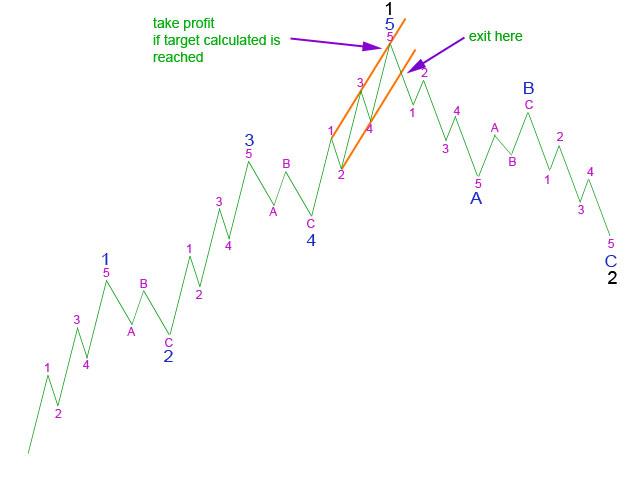
What wave degree you choose to trade will depend entirely upon what style of trading suits you best. If you don’t like to hold positions overnight or over a weekend then you would trade on hourly charts at wave degrees below minor. If you like to hold trades for weeks or months and don’t like to enter and exit so often you would trade on daily charts wave degrees at minor or intermediate.
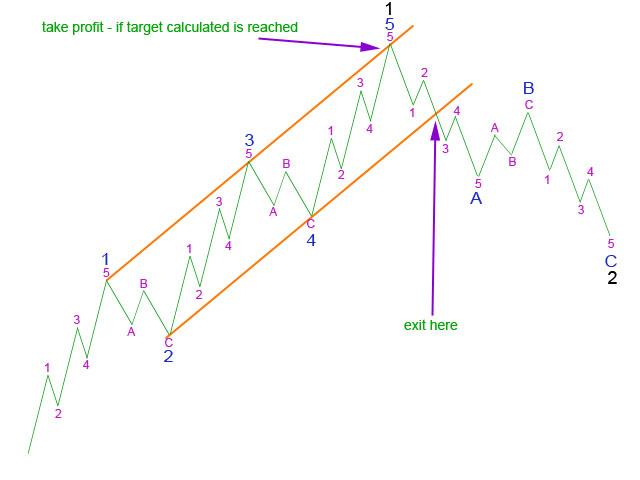
Using this strategy you would trade this first wave at minor degree which may last several days to a couple of weeks or so. If your calculated target was reached you may exit about the high. If price fell short of your calculated target you would exit the trade when the channel is breached in the direction opposite to your trade.
How would you add to a longer term position?
Corrections may be used as opportunities to join the trend.
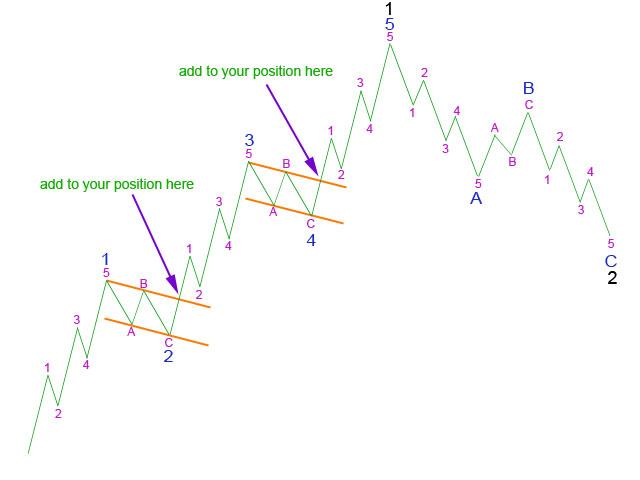
In the above diagram you may add to your position in the early stage of the third wave, and again in the early stage of the fifth wave. You can take this idea and move it down one degree; you may also add to your position when each of the lower degree corrections are confirmed complete with their own channel breaches. There would then be several opportunities to add to a position, and you would need to use good sound money management methods to know how much to load up your account. A good rule of thumb would be to keep leverage at 10:1 or below, and only risk a maximum of 2% of your account on any one trade.
In the diagrams above the structures shown are the simplest possible; impulses and zigzags. However, in reality there is a lot more variation than this, particularly for corrections. Zigzags lend themselves very well indeed to parallel channels, but flat corrections do not. Combinations and double and triple threes also do not lend themselves to trend channels at all. For these structures you draw a channel about the final C wave of the final structure and use this channel to indicate an end to the correction. Some real life examples from EURUSD and GBPUSD are provided below.
Real life examples of third waves.
The holy grail of Elliott wave analysis for traders is a third wave. Third waves are strong and carry price in a clear direction. They’re usually the longest movement within a larger movement so offer the biggest profit opportunity. The best thing about third waves I think is their structure. They can only subdivide into a five wave impulse. This is the easiest structure to analyse and also to trade. Because there is only one structure variation is limited, and so there should be less error in analysis.
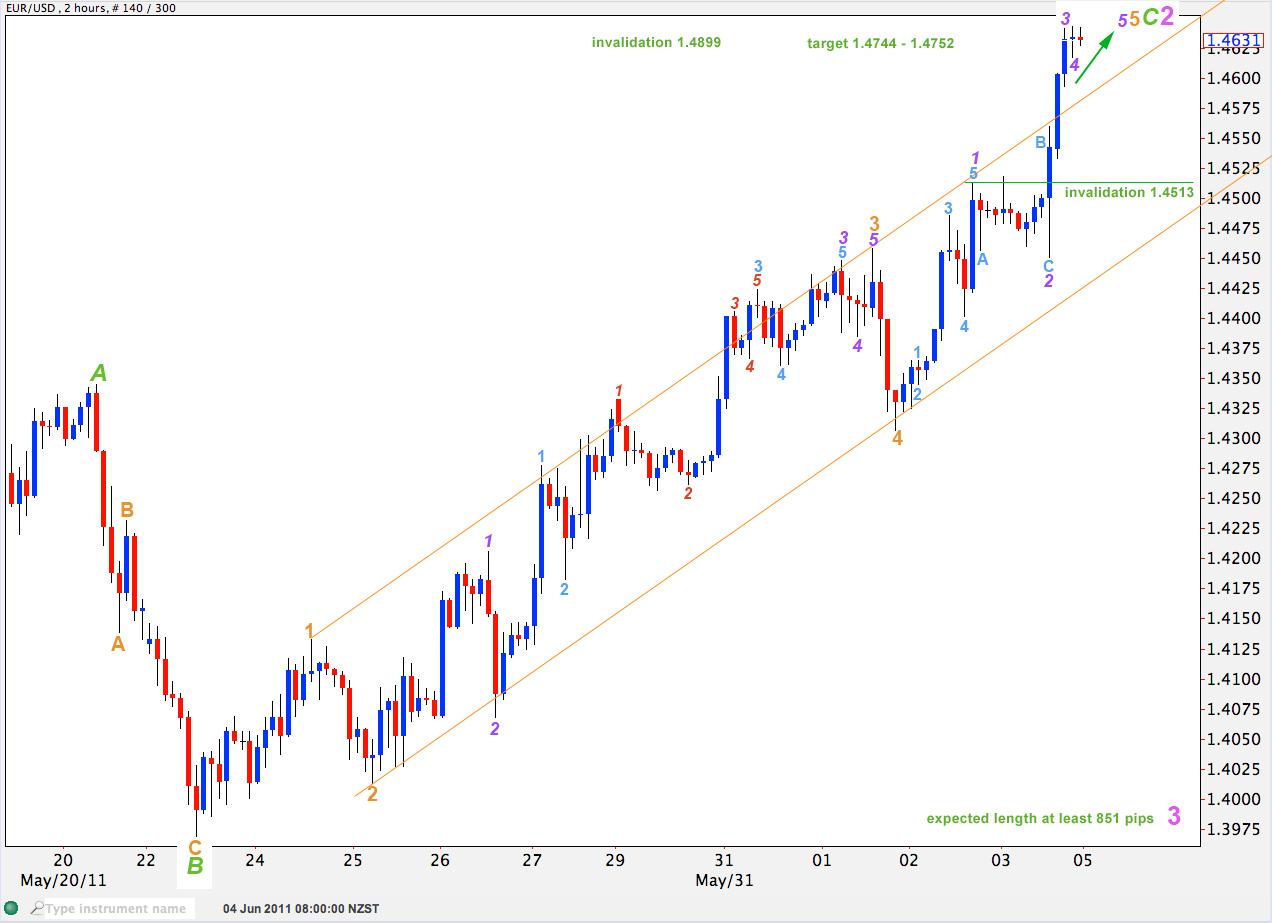
In the example above we are looking for the end to a second wave. Because this second wave is an expanded flat correction we cannot draw a trend channel about its whole, but we may draw a channel about its C wave. When the channel is breached we have our indication that downwards movement may be the third wave to follow. Once we have trend channel confirmation that a third wave is underway we enter a short position. To time our entry we could use a 15 minute chart with Bollinger bands and MACD as explained here.
If the wave count is correct and this is a third wave we would want to take profit at the target.
In the following example the second wave is a double combination. It is not possible to draw a satisfactory channel about a combination.
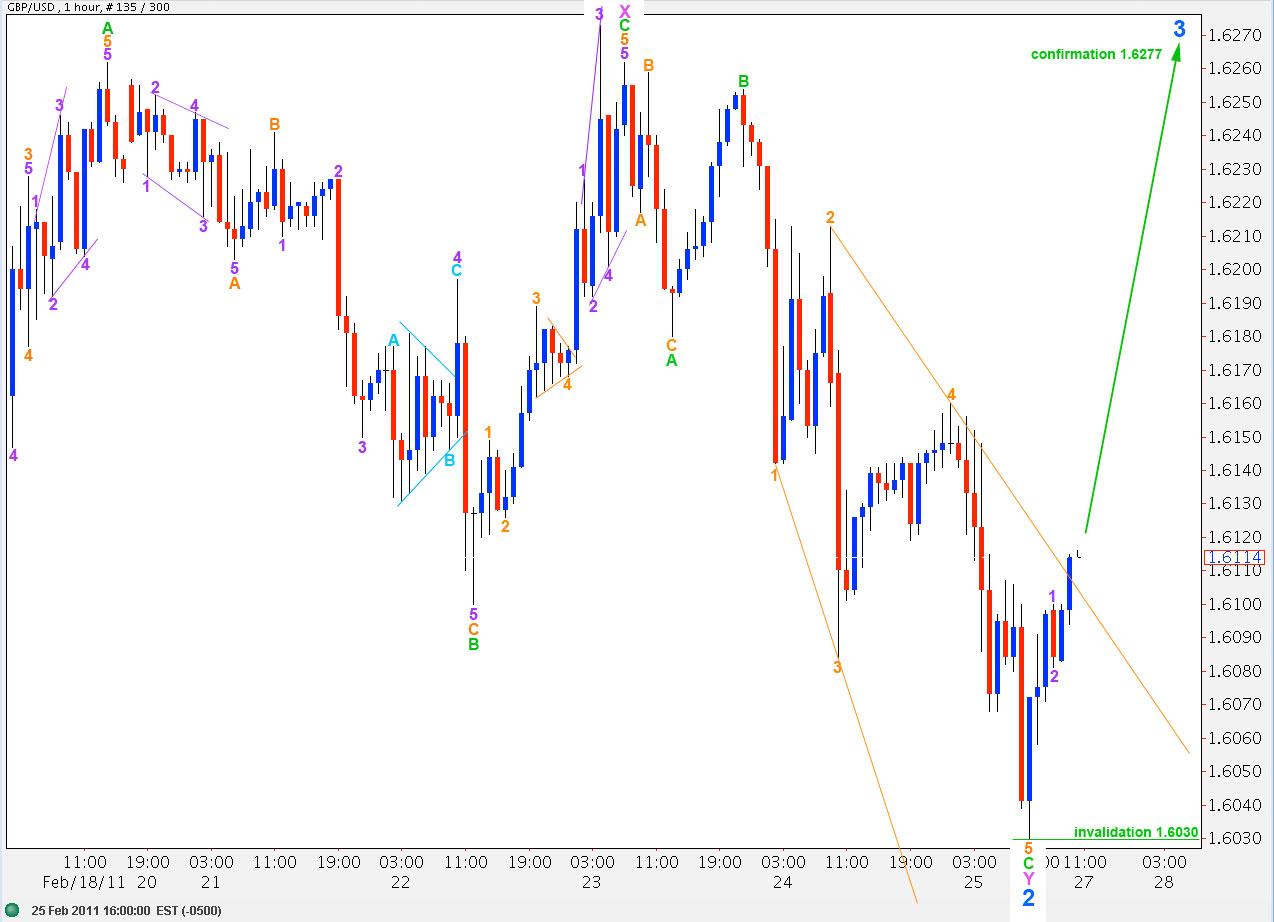
We could draw a channel around the flat for wave Y pink of wave 2 blue, but we would be waiting for about half of wave 3 to unfold before this channel would be breached. Flat corrections do not lend themselves well to good trend channels.
Once we can see a satisfactory structure for wave C green, as has just completed in the chart above, we would expect for the next movement to be a third wave upwards. We may enter a long position when the trend line for the upper edge of the ending diagonal for wave C green is clearly breached. Stops would be set at 1.6029 or a few pips below.
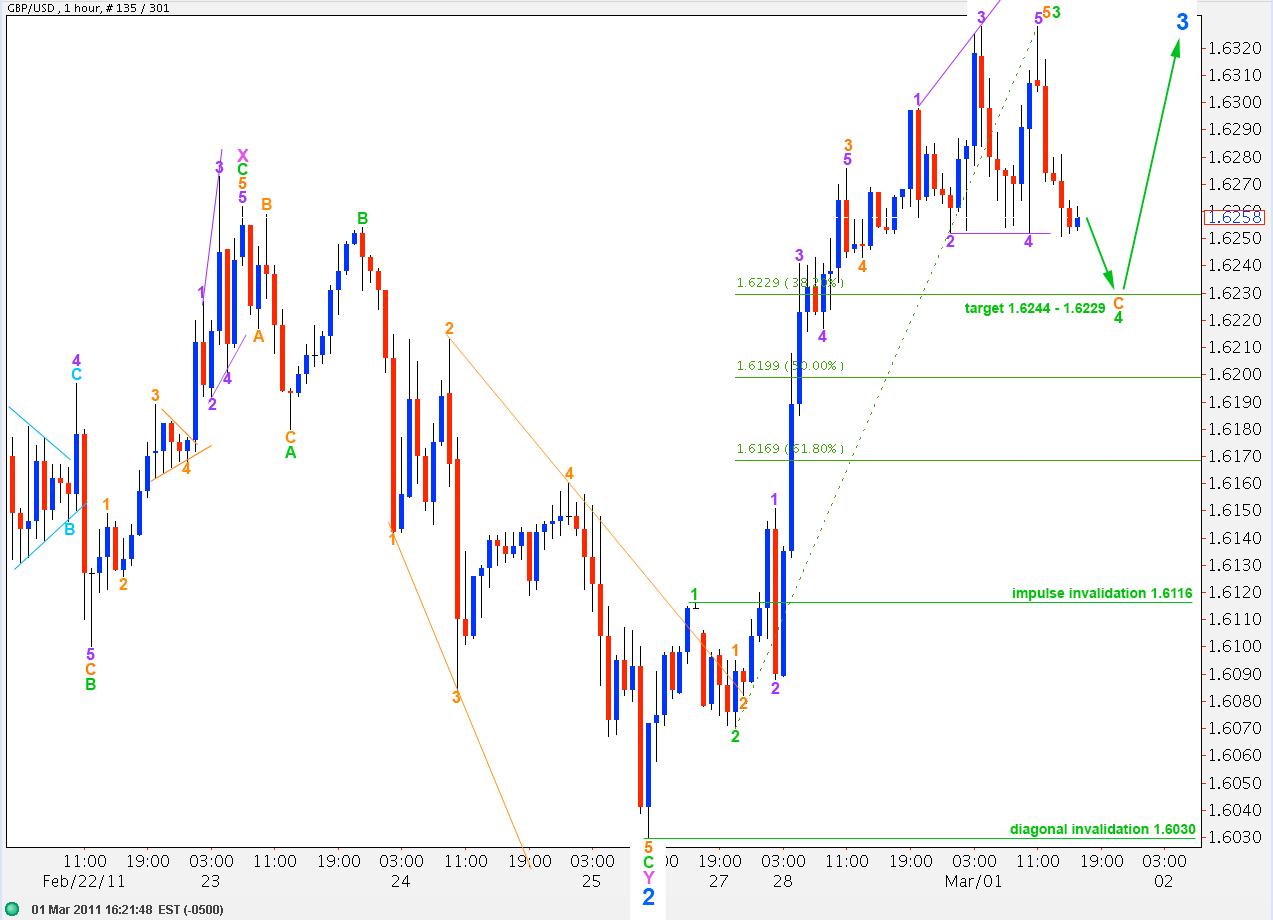
In this instance our wave count was correct and we would have made a good profit.
The approach to using Elliott wave analysis to trade markets as outlined here is not by any means the only valid approach. You may find it too cautious, you may find it too risky. Every trader will have their own preferred methods.
In conclusion, the best most profitable and longest lasting traders are the ones who manage the money in their trading accounts most wisely. Even if your wave count correctly predicts direction for the next 24 hours you can still manage to lose money, if you over leverage and let fear be your guide. Keeping leverage at 10:1 or below will allow you to have losses and still survive.
Author

Lara Iriarte, CMT
Elliott Wave Gold
Lara Iriarte is a Chartered Market Technician and a Registered Financial Advisor in New Zealand.
















