![]() Markus Heitkoetter
Markus Heitkoetter
Rockwell Trading
I want to show you how to calculate the best stop loss order if you are trading stocks.
We’ll look at specific examples like Tesla and Apple.
Now this is for you if you are trading, because trading is different than investing.
When trading, you’re actively placing a stop loss to limit your losses and a profit target where you take profits.
Today we’re going to focus on how to limit your loss because we want to make sure that you are not losing your shirt when trading.
So let’s get started.
So, first of all, when we talk about placing a stop loss order…
There are two things that you need to keep in mind
First of all, we are looking at a stop loss on a per trade basis. Anytime you’re entering a trade, you need to limit your risk.
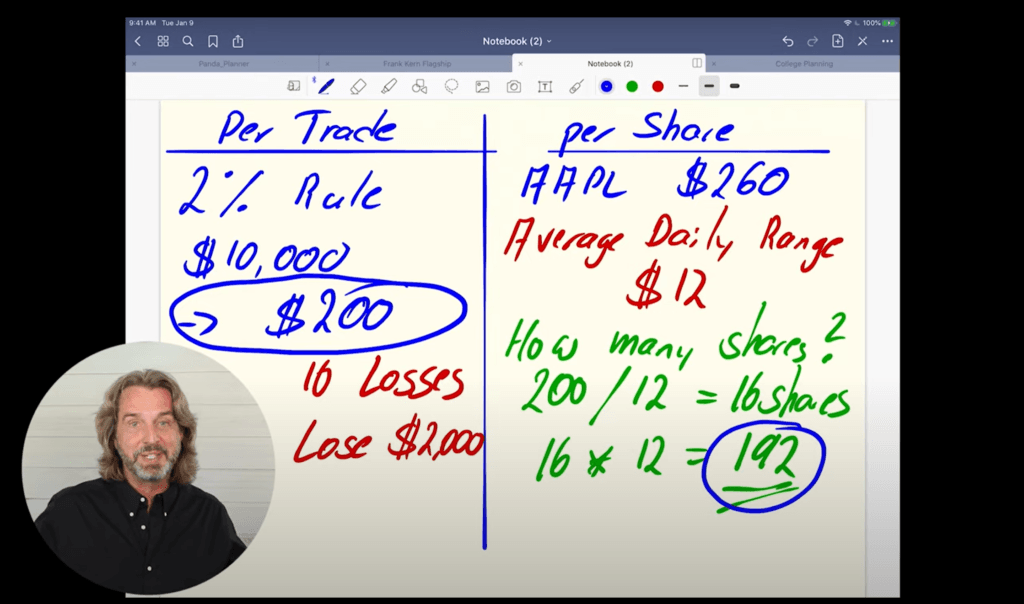
And this is where we are looking at the 2% rule. What does the 2% rule mean? The 2% rule means you never risk more than 2% of your account on any given trade.
So let’s say that you have a $10,000 account. When you have a $10,000 account, your risk should be 2% of $10,000, which is $200.
Never risk more than $200 of your account on any given trade, and here’s why.
Now, let’s say that you have, for example, 10 losses in a row, which can happen. So if you lose 10 times $200, you lose $2,000.
Now, of course, this is not nice, but you still have $8,000 left. So you’re still alive. You can still trade, right? You started with the $10,000 account.
You have 10 losses in a row, which, by the way, is quite an accomplishment, because if you have 10 losses in a row, you might want to revisit your strategy and go back on a simulator for a little bit.
But you see, this is the key when limiting your losses, you’re still alive. You only lost $2,000 and you can still trade and make back the money that you lost.
So never risk more than 2% on any given trade. However, here is the deal.
Now the question is how much should you risk per share that you’re trading?
This is important to distinguish between these two.
Let me just use Tesla as an example…
Stop loss order example using Tesla
So Tesla right now is trading at $550.
So when I’m talking about having a stop loss of $200, the 2% rule per trade, does this mean that you should apply a $200 stop loss to Tesla? Meaning that if Tesla goes down to $350 that you’re selling it?
No, this is not what it means.
When we calculate the best stop loss per share, I like to use a concept that is called the average daily range.
And I’m going to show you in a moment on the chart what it means.
With the average daily range, I like to look back over the past seven days. I want to know how much did a particular stock move on average.
So, here I have a chart of Tesla.
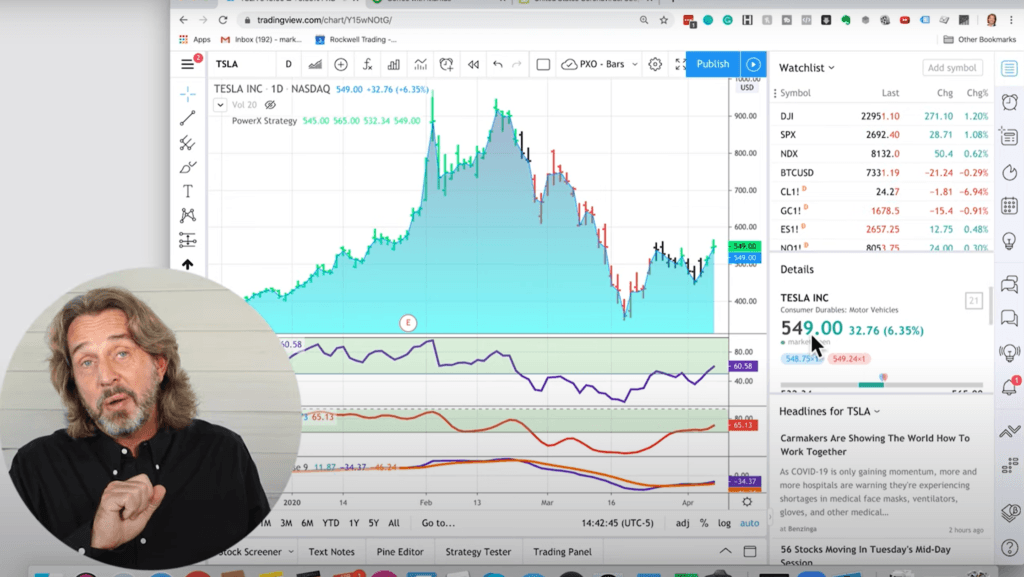
Right now, as of April 7th, Tesla is trading at almost $550. Now, here is what I would like to look at.
I personally like to calculate the average daily range. It’s slightly different than the average true range.
But for our example here, we can use the average true range. Here’s what you do.
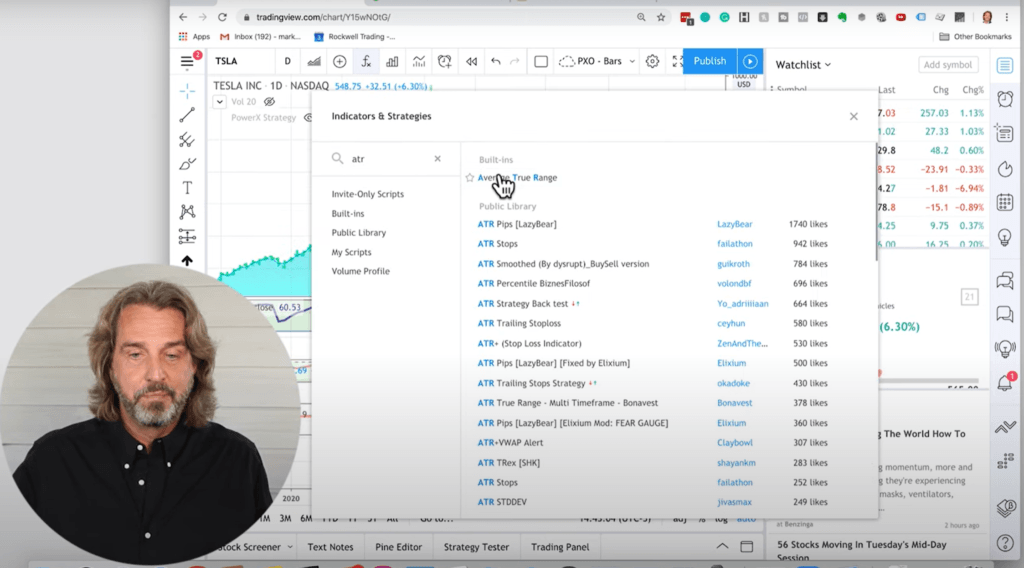
You click on the “F” icon at the top and you search for the ATR, the average true range.
Now when you do, see, it’ll show it right here on the screen and I want to make sure that I customize it.
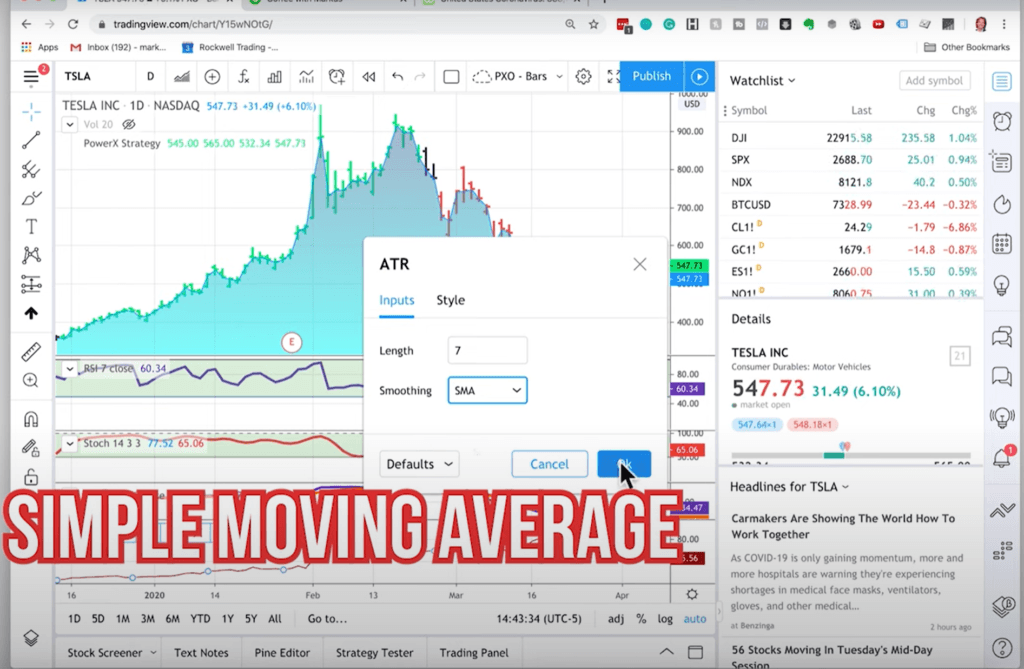
I’m clicking here on the ATR, on the little gear icon and I’m changing the length to 7. And for the smoothing, I don’t use an RMA, I’m using an SMA.
This is a simple moving average.
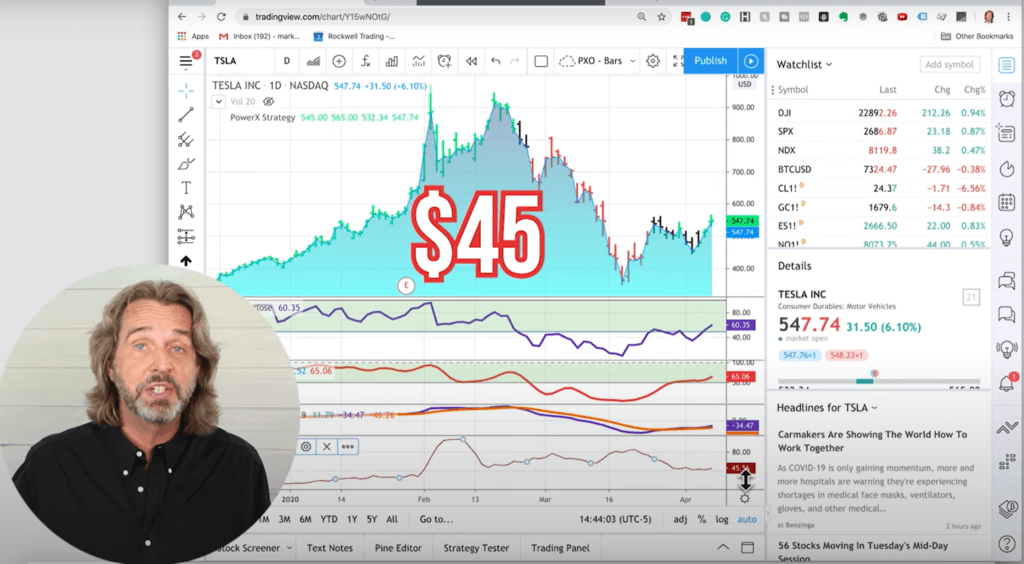
All right. So this is where you can see right now, Tesla on average. You see it right here at the bottom that Tesla on average is moving at $45 per day.
Today alone, compared to yesterday, it’s up $32.
So this means that you need to place a stop loss order of at least $45 when you’re swing trading stocks. Otherwise, you will be stopped out way too quickly.
You’re looking at the average daily range. For Tesla here, this is $45.
This is $45 per share, meaning that if Tesla goes down from $550 to $505 this is when you would get rid of it.
This is when you say, “I was wrong.” It’s going in the wrong direction. You’re buying Tesla because you want Tesla to go up.
If it is moving against you get out before it gets worse!
However, if we want to risk $45 per share, and now we also want to overall risk $200 per one trade, this Tesla trade, how many shares are we allowed to trade?
You get the idea. We take the $200 and now divide it by $45. This means that we can trade 4 shares of Tesla because 4 times $45 means we are risking $180 overall on this trade.
Stop loss order example using Apple
So now we want to do the same thing and we’re doing it for Apple.
So Apple right now is trading at $262, let’s just say $260 as I’m recording it. So let’s take a look at the charts.
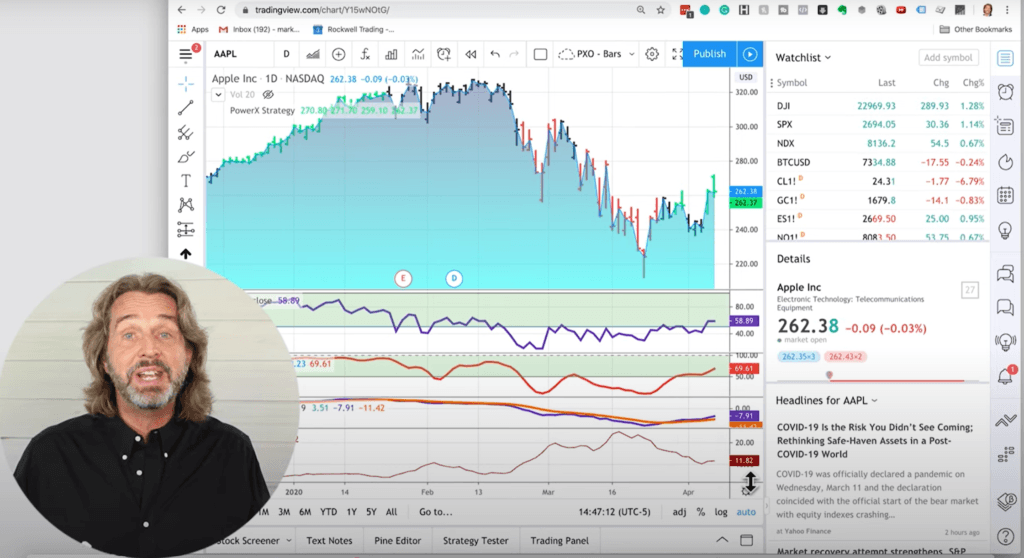
Again, what you want to do here is look at the ATR, the average true range, or I like to use the average daily range.
The average daily range is not built into TradingView, so therefore we use the average true range.
And you see it is $11. Quite different from Tesla where it was $35.
You see, when you have a stock that is more volatile, you have to apply a larger stop loss order. And here we can apply a smaller stop loss.
We have to give the stock at least $12. Otherwise, we’re getting stopped out too quickly.
But on the other hand, if you’re buying it and it doesn’t immediately move up, get out right away.
Now we have the average daily range of $12, And overall on this trade we want to risk $200. So how many shares should we trade of Apple?
Previously in the example of Tesla, we were trading 4 shares.
And here we’re taking the $200 that we want to risk overall and divide it by $12. It’s around 16 shares.
So this means instead of trading 4 shares like with Tesla, we are trading 16 shares of Apple.
What does this mean?
16 shares times $12 per share that we are risking would be $192 that we risk, which is in line with the overall $200 that we want to risk.
It is very important that you use the 2% rule for the overall risk per trade, and then you use the average daily range to calculate how much you should risk per share.
So in our example here, Apple, if Apple moves down from $260, down by $12 to $248, you get out of it because it means that you were wrong.
Now when you apply these two key principles, this is how you preserve your trading account.
Because with the 2% rule, as you can see here on the left-hand side, this is how we make sure that we are not wiping out our account on a single trade.
And now, the key question is…
How much should you risk per share?
This really depends on the stock that you are trading. Stocks that are more volatile like Tesla require a larger stop loss.
Stocks that are a little bit less volatile like Apple right now require a smaller stop loss.
All right. Hope this helps.
Trading Futures, options on futures and retail off-exchange foreign currency transactions involves substantial risk of loss and is not suitable for all investors. You should carefully consider whether trading is suitable for you in light of your circumstances, knowledge, and financial resources. You may lose all or more of your initial investment. The lower the day trade margin, the higher the leverage and riskier the trade. Leverage can work for you as well as against you; it magnifies gains as well as losses. Past performance is not necessarily indicative of future results.
Editors’ Picks
EUR/USD clings to daily gains above 1.0650

EUR/USD gained traction and turned positive on the day above 1.0650. The improvement seen in risk mood following the earlier flight to safety weighs on the US Dollar ahead of the weekend and helps the pair push higher.
GBP/USD recovers toward 1.2450 after UK Retail Sales data

GBP/USD reversed its direction and advanced to the 1.2450 area after touching a fresh multi-month low below 1.2400 in the Asian session. The positive shift seen in risk mood on easing fears over a deepening Iran-Israel conflict supports the pair.
USD/JPY goes on a roller-coaster ride prompted by geopolitical risk

USD/JPY whipsaws lower and then higher on alternating risk-on risk-off caused by Middle East tensions. Governor Ueda talks about defending the Yen from further weakness and currency-induced imported inflation. USD/JPY price chart shows bearish Hanging Man forming, boding ill for future price action.
Editors’ Picks
EUR/USD clings to daily gains above 1.0650
EUR/USD gained traction and turned positive on the day above 1.0650. The improvement seen in risk mood following the earlier flight to safety weighs on the US Dollar ahead of the weekend and helps the pair push higher.
GBP/USD recovers toward 1.2450 after UK Retail Sales data
GBP/USD reversed its direction and advanced to the 1.2450 area after touching a fresh multi-month low below 1.2400 in the Asian session. The positive shift seen in risk mood on easing fears over a deepening Iran-Israel conflict supports the pair.
Gold holds steady at around $2,380 following earlier spike

Gold stabilized near $2,380 after spiking above $2,400 with the immediate reaction to reports of Israel striking Iran. Meanwhile, the pullback seen in the US Treasury bond yields helps XAU/USD hold its ground.
Bitcoin Weekly Forecast: BTC post-halving rally could be partially priced in Premium

Bitcoin price shows no signs of directional bias while it holds above $60,000. The fourth BTC halving is partially priced in, according to Deutsche Bank’s research.
Week ahead – US GDP and BoJ decision on top of next week’s agenda

US GDP, core PCE and PMIs the next tests for the Dollar. Investors await BoJ for guidance about next rate hike. EU and UK PMIs, as well as Australian CPIs also on tap.
RECOMMENDED LESSONS
Making money in forex is easy if you know how the bankers trade!
Discover how to make money in forex is easy if you know how the bankers trade!
5 Forex News Events You Need To Know
In the fast moving world of currency markets, it is extremely important for new traders to know the list of important forex news...
Top 10 Chart Patterns Every Trader Should Know
Chart patterns are one of the most effective trading tools for a trader. They are pure price-action, and form on the basis of underlying buying and...
7 Ways to Avoid Forex Scams
The forex industry is recently seeing more and more scams. Here are 7 ways to avoid losing your money in such scams: Forex scams are becoming frequent. Michael Greenberg reports on luxurious expenses, including a submarine bought from the money taken from forex traders. Here’s another report of a forex fraud. So, how can we avoid falling in such forex scams?
What Are the 10 Fatal Mistakes Traders Make
Trading is exciting. Trading is hard. Trading is extremely hard. Some say that it takes more than 10,000 hours to master. Others believe that trading is the way to quick riches. They might be both wrong. What is important to know that no matter how experienced you are, mistakes will be part of the trading process.